This month’s scan of the most overbought Dow’s stocks has many of the recent top performers and the monthly charts of these four, says MoneyShow’s Tom Aspray, makes them attractive buy candidates on a correction.
The impressive stock market gains so far in 2013 has certainly gotten the attention of both the media and the investing public. Anyone who doesn’t know that the Dow Industrials closed above 14,000 Friday must be living in a cave.
Most also know that historically a higher close in January has meant that stocks will be up for the entire year. This, of course, is based on average gains and as I pointed out on Friday the yearly performance after a higher January was varied widely. The last time the market had this strong a close was 1997 and it ended the year with a 31.7% gain.
Even in 1997 stocks peaked on February 18 and then underwent a 10.4% correction. Therefore the monthly starc band scan of the stocks in the Dow Industrials can help identify those stocks to buy when the market corrects.
For those who are not familiar with these monthly scans, it identifies those stocks that are closest to either the upper (starc+) or lower (starc-) bands. When a stock is near the starc+ band, it is a high-risk buy but that does not mean the stock cannot still go higher. If a stock closes above the monthly starc+ band for several consecutive periods, then it becomes increasingly more vulnerable.
At the top of this month’s list is The Travelers Companies (TRV), which the table indicates closed the month at $78.46, 3.5% below its monthly starc+ band. It was also one of the month’s best performers, up 9.2% while the second stock on the list, Pfizer Inc. (PFE) was up 8.7%.
A close analysis of the monthly charts allows one to better identify those that are just beginning a new run to the upside and are likely the best ones to buy on a correction. Let’s take a look at those stocks whose monthly charts suggest have the best upside potential.
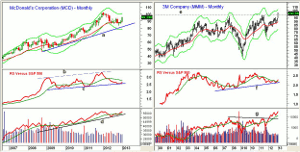
Chart Analysis: McDonald’s Corporation (MCD) was the star performer in 2011, up 30.7%, but it was followed by a 4.4% loss in 2012. The monthly chart shows a normal corrective pattern from the January 2012 high at $102.22.
- The January close above the September-October 2012 highs at $94-$94.16 highs suggests that the correction was over.
- The 127.2% Fibonacci upside retracement target from the corrective pattern is at $107.41.
- The monthly relative performance has turned up from long-term support, line c, but is still well below its WMA.
- The RS line did confirm the highs made in early 2012, line b.
- The monthly OBV has moved above its WMA after holding above the support at line d.
- The weekly technical studies (not shown) have moved above their MAs indicating that a new uptrend is underway.
- The weekly OBV (not shown) has moved well above the early 2012 highs.
- The downtrend on the weekly chart and first support is at $91.35 with the quarterly pivot at $89.20
- MCD yields 3.2%.
The 3M Company (MMM) broke out of a 12-year trading range in January as it closed well above the resistance at $98.40, line e.
- From the October 2011 lows at $68.63, the 127.2% Fibonacci target is at $105.
- There are longer-term targets in the $120-$125 area.
- The monthly relative performance has turned up from long-term support, line f, that goes back to 2006.
- The RS line has moved back above its WMA.
- The on-balance volume (OBV) is much stronger as it overcame resistance going back to 2007 in early 2012.
- The OBV has continued to make new highs and is well above its rising WMA.
- There is initial support now at $98.50 with stronger at $95.50-$96
- MMM yields 2.30%.
NEXT PAGE: More Stocks with Upside Potential |pagebreak|
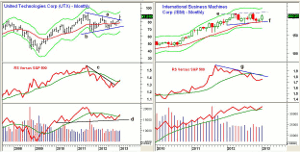
United Technologies Corp. (UTX) completed a 19-month flag formation in January, lines a and b.
- Once above the July 2011 high of $91.83, the 127.2% Fibonacci target is at $98.64.
- The width of the flag formation has upside targets in the $100-$102 area.
- The monthly relative performance broke its downtrend in November and it has now moved above its WMA.
- Looking at multiple times, the weekly RS analysis (not shown) completed its bottom in early December and it was confirmed by the daily relative performance.
- The OBV peaked with prices in 2011 but held the support at line d and has now moved back above its WMA.
- There is initial support at $87.50 with stronger at $83.80-$85.40.
- UTX yields 2.4%.
International Business Machines (IBM) has been in a broad trading range, lines e and f, for the past ten months.
- This appears to be a continuation pattern with the 127.2% Fibonacci at $129.47.
- There are major upside targets from the trading range at $235-$245.
- The monthly relative performance is still below its downtrend and it’s declining WMA.
- The monthly OBV tested its rising WMA in November before turning higher.
- The OBV could make new highs in the next month.
- The weekly OBV (not shown) has broken out of its trading range.
- There is first good support now at $197.64, which is the quarterly pivot with further at $194.80-$196.
What it Means: Three of the four Dow companies have just recently completed continuation patterns, so a pullback over the next month should be well supported.
3M Company (MMM) has just overcome major resistance and, therefore, all owners of MMM are showing profits. A retest of the breakout levels is expected to be well supported.
How to Profit: For McDonald’s Corporation (MCD), go 50% long at $92.88 and 50% long at $92.10, with a stop at $86.46 (risk of approx. 6.5%).
For 3M Company (MMM), go 50% long at $96.78 and 50% long at $95.88, with a stop at $90.86 (risk of approx. 5.6%).
For United Technologies Corp. (UTX), go 50% long at $85.84 and 50% long at $84.16, with a stop at $79.77 (risk of approx. 6.1%).
For International Business Machines (IBM), go 50% long at $198.16 and 50% long at $196.28, with a stop at $187.73 (risk of approx. 4.8%).
Portfolio Update: Per last month’s article, should be 50% long Wal-Mart Stores Inc. (WMT) at $68.34 and 50% long at $67.72. Use a stop now at $68.84.
I have been recommending Johnson and Johnson (JNJ) for the past two months but my buy levels have not been hit. I will be watching for a pullback in the next month.
Editor’s Note: If you’d like to learn more about technical analysis, attend Tom Aspray’s workshop at The Trader’s Expo New York, February 17-19. You can sign up here, it’s free.


