Canadian banks, held up as role models for American banks during the financial crisis, can provide safe and higher sources of income for yield-starved investors, notes MoneyShow’s Tom Aspray.
The market racked up another day of gains Tuesday and the market internals were positive by almost a 2-1 margin, which was stronger than prices. The trading ranges were narrow again on Monday, similar to last Friday as the S&P futures traded in a 10-point range.
As I discussed yesterday, I think buying the market at current levels has a high risk. A drop below $167 in the Spyder Trust (SPY) or 1657 in the S&P futures will be the first real sign that a short-term top is in place. This will also allow me to target the likely levels for a pullback.
The yields on the 10-year T-note have continued to drift lower, which is consistent with the overbought status discussed in late June. It has not been a good year for the Canadian stock market as the iShares MSCI Canadian Market Index (EWC) is down 5% so far in 2013. This is a 20% difference when compared to the Spyder Trust (SPY).
This decline has brought some of the Canadian banks down to good support and these two were on Bloomberg’s ten strongest banks list, have good prospects for dividend growth and also looking attractive from a technical standpoint.
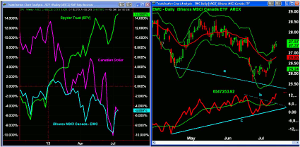
Chart Analysis: The % change chart since the start of the year shows the divergence between the Spyder Trust (SPY) and the Canadian stock market as represented by the iShares MSCI Canada Index (EWC).
- The Spyder Trust (SPY) is up close to 15%, so far in 2013, while EWC is down almost 5%.
- The Canadian dollar closed 2012 just above par but hit a low of 0.94 cents in early July.
- This was a 20-month low for the C$.
- The weekly OBV on the Canadian dollar futures (not shown) has been below its WMA since last November.
- The chart shows that both have bounced from the early July lows.
The daily chart of the iShares MSCI Canada Index (EWC) shows a pattern of lower lows, line a, as the daily starc- band was violated on June 24.
- EWC is now testing its daily starc+ band as it gapped higher last Thursday.
- The close last week was above the quarterly pivot at $26.83 with next strong resistance in the $28.60-$28.72 area.
- The high in 2011 for EWC was $34.57.
- The daily on-balance volume (OBV) shows a pattern of higher lows or a bullish divergence as it bottomed in April and formed a higher low in June, line c.
- The OBV tested its WMA on July 5 before surging to the upside and breaking its downtrend, line b.
- The OBV is acting stronger than prices but the weekly (not shown) is still below its WMA.
- There is support at the gap $27.05-$26.50, which includes the rising 20-day EMA.
- More important support is at the June low of $25.61 and major is at $24.83, which was the 2012 low.
NEXT PAGE: 2 High-Yielding Canadian Bank Stocks
|pagebreak|The Royal Bank of Canada (RY) has assets of $86.4 billion with a current yield of 4.10%. Its dividend is $2.43. At the February high of $64.08, it was yielding 3.80%.
- It is the 4th strongest bank on Bloomberg’s list and has a five-year dividend growth of 4.61%.
- The 10-year rate is much better at 11.61%.
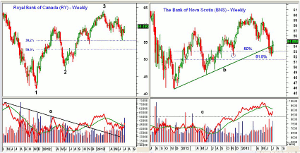
- The chart shows that the June low tested the major 38.2% Fibonacci support calculated using the rally from the 2011 low (point 1) and the 2013 high (point 3).
- This was also the minor 50% support of the rally from point 2 to point 3.
- The weekly OBV broke its downtrend, line a, in September 2012 and then retested the breakout level in November.
- The volume was strong last week as the OBV moved above its WMA.
- The daily OBV (not shown) is also above its WMA.
- There is initial support at the quarterly pivot at $59.08 with the 20-day EMA at $58.58.
- The monthly pivot is at $58.26 with the early June low at $56.95.
The Bank of Nova Scotia (BNS) is a bit smaller with assets of $65.8 billion and a current yield of 4.20%. At the March high of $63.05, the yield was 3.63%.
- BNS has a five-year dividend growth of 4.71%. with a 10-year rate at 11.69%.
- The uptrend from the 2011 lows, line b, was broken on the June decline.
- The low in early July was $52.05, which was below the 50% Fibonacci support at $52.99 but held above the 61.8% support at $51.28.
- This low also undercut the low from November 2012 (see circle).
- The OBV has turned up from support at line c, but is still below its WMA.
- The weekly OBV did make a new high in May.
- BNS closed Tuesday just above the quarterly pivot at $54.97 with next resistance at $56.57.
- There is further resistance at $57.16 to $57.98, which was the May high.
- The 20-day EMA is at $54.15 and then further support at $53.40.
What it Means: Though Canada’s economy seemed to be lagging the US economy, I think the selling in Canadian stocks has been overdone.
iShares MSCI Canada Index (EWC) has a yield of 2.61%, with a 7.2% holding in the Royal Bank of Canada (RY) and 5.4% in the Bank of Nova Scotia (BNS). It has 40.5% in its top ten holdings. A pullback should set up a buying opportunity.
Of the banks, the Royal Bank of Canada (RY) looks the best, but both look attractive at lower levels.
How to Profit: For the iShares MSCI Canada Index (EWC), go 50% long at $26.72 and 50% long at $26.29, with a stop at $25.21 (risk of approx. 4.9%).
For the Royal Bank of Canada (RY), go 50% long at $58.83 and 50% long at $58.19, with a stop at $56.19 (risk of approx. 4.0%).
For the Bank of Nova Scotia (BNS), go 50% long at $53.44 and 50% long at $52.7,8 with a stop at $51.93 (risk of approx. 2.2%).


