
Yesterday was a good day for the stock market, as a bottom might have been reached sooner than expected, and now, MoneyShow's Tom Aspray, suggests buying two ETFs, with clearly defined entry and exit plans, on a dip.
It was another good day for the stock market, as advancing stocks again supported the price action. The Dow Jones Transportations led the way, gaining 1.9%, while the industrial sector also did well with the Select Sector SPDR Industrials (XLI) gaining 1.45%.
The technical action this week has resolved the short-term negative divergences that I reviewed in Friday's Week Ahead column. There are still some longer-term negative divergences between the NYSE Composite and its Advance/Decline line, but the trend, for now, is up.
The five-day gain of 2.6% in the Spyder Trust (SPY), and the closeness to the daily starc+ bands, suggests that this is not a market to chase. One often hears someone recommending to "buy the dips," but, as I have noted in previous articles, this needs a well-defined plan for both the entry and exit in order to be successful.
In the next week or so the market is likely to see a one-to-three day pullback, as, even though Syria has moved to the back burner recently, there are plenty of other reasons that investors are nervous about buying. There are two strong ETFs that I like in particular and have designed a concrete plan to buy them on a dip.
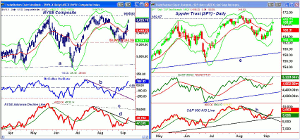
Click to Enlarge
Chart Analysis: The daily chart of the NYSE Composite shows Tuesday's up gap and close at the daily starc+ band.
- The NYSE was the only major average that failed to surpass the May highs
this summer.
- There is, therefore, key resistance at 9695 and a strong close above this
level would be a very bullish sign.
- The 2008 high was 9781 with the weekly starc+ band now at 9925.
- The McClellan oscillator has continued to rise from the October lows and
is now at 166. This is not far below the July high at 205.
- The NYSE
Advance/Decline has broken its short-term downtrend, line d, and moved
well above its WMA.
- There is more important resistance at line c, which, if overcome, would be
a very strong sign.
- There is initial support at 9500-9449, and the now rising 20-day EMA.
- The monthly pivot stands at 9402 with the quarterly
pivot at 9251, which held on the recent correction.
The Spyder Trust (SPY) is now very close to the quarterly R1 resistance at $169.01, with the daily starc+ band at $169.73.
- There is next resistance at $169.97, with the August high at $170.97.
- The weekly starc+ band is at $174.57.
- The daily on-balance
volume (OBV) has moved sharply higher and is now very close to the August
high.
- The OBV is acting stronger than prices and is well above its rising WMA.
- The downtrend in the S&P 500 A/D line has been convincingly
broken.
- Initial support is now at its slightly rising WMA, as the longer-term
support, line h, held on the correction.
- There is support first at $167 with the monthly pivot at $165.89 and R1
support at $164.47.
NEXT PAGE: 2 ETFs to Watch
|pagebreak|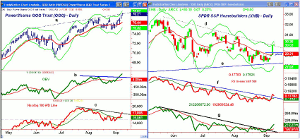
Click to Enlarge
The PowerShares QQQ Trust (QQQ) continues to be a market leader as it is up 3.6% so far this month, closing Tuesday at trend line resistance, line a.
- The daily starc-
band at $78.81 is not far above the close with the weekly at $80.57.
- The daily OBV has moved well above the August highs, lines b, which is a
bullish sign.
- The weekly OBV (not shown) is also above its WMA.
- The Nasdaq 100 A/D line did form a negative divergence, line c, at the
early August highs.
- The break of this downtrend does suggest that the correction is over.
- There is initial support in the $76.60-$77.20 area with monthly projected
support at $74.53.
The SPDR S&P Homebuilders (XHB) has had a sharp bounce over the past three days, as it reached the daily starc+ band. As I have mentioned before, it actually contains homebuilding-related stocks and not too many homebuilders. Its two largest holdings of just under 4% are Lumber Liquidators Holdings (LL) and Lowe's Companies (LOW).
- The daily downtrend, line d, was broken Tuesday with next resistance at
$31.38-$31.65.
- In May, the high was $32.69, so the 50% Fibonacci
retracement resistance is at $30.41.
- The daily
relative performance has broken its downtrend, line f, and moved above its
previous high.
- The OBV has also moved sharply through its resistance, line g, and
completed its bottom formation.
- The weekly OBV (not shown) is also now above its WMA.
- There is initial support in the $29.50 area with the monthly pivot at
$29.27.
- The support in the $28-$28.50 area is even more important.
What it Means: The improvement in the technical studies does suggest that the market completed a bottom in late August, which was sooner than I expected. On a short term basis, many of those on the short side have been squeezed out already. This increases the odds of a pullback, especially with the FOMC meeting next week.
There are quite a few stocks in both the health care and materials sector that I have recommended, but several of the orders have not yet been filled. I also like the iShares Russell 2000 Index (IWM) and will be sending out a Tweet once we get a pullback.
The PowerShares QQQ Trust (QQQ) and SPDR S&P Homebuilders (XHB) look like prime candidates to buy on a dip.
How to Profit: For the PowerShares QQQ Trust (QQQ) go 50% long at $77.42 and 50% long at $76.64 with stop at $73.13 (risk of approx. 5%).
For the SPDR S&P Homebuilders (XHB) go 50% long at $29.44 and 50% long at $28.94 with stop at $27.77 (risk of approx. 4.9%).


