After looking at a market-leading sector yesterday, MoneyShow's Tom Aspray goes prospecting in a lagging sector today.
Monday was the worst day for the stock market since last November as the Spyder Trust (SPY) was down 1.33%. This was better than the 2% or greater declines in the Philadelphia Housing and Oil Service sectors.
The market selloff was blamed on lower crude oil prices along with concerns about the earnings season, which hits full stride this week. So far, 90% of the companies that have released pre-announcements for the earning season have lowered their estimates.
Asian markets were hit hard overnight but the losses, so far, are not that bad in the Eurozone. The banks will get the focus today with JPMorgan Chase & Co. (JPM) and Wells Fargo & Company (WFC) reporting today. JPM just reported a 7.3% drop in quarterly profits before the opening.
The technical deterioration in the energy sector was noted in early January, so the sharp decline on Monday was not a real surprise. It has been a lagging sector in 2013 but some of its industry groups have done much better.
The Oil and Gas Refiners and Marketers have been doing the best as they have outperformed the Major Integrated Oil and Gas companies by double digits over the past three months. So where are the next key support levels for this key economic sector and will the seasonal tendencies play a role?
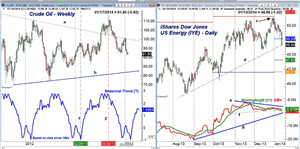
Chart Analysis: The weekly chart of the crude oil futures shows that the late 2013 lows have been violated in early 2014.
- In July 2013, the weekly downtrend, line a, was
broken, which was a positive sign.
- Therefore, the reversal from the August highs was
sharper than expected.
- The rebound in late 2013 retested the downtrend and
just retraced 38.2% of the prior decline.
- There is next good support in the $85-$88 area.
- The seasonal tendency for crude oil, based on data
going back to 1984, reveals that crude does typically top at the end of August
(line 2), so the 2013 high was right on target.
- Typically, prices bottom in early February (line 1),
so the next few weeks will be interesting.
- A weekly close back above the quarterly pivot for the March contract at $97.57 is
needed to stabilize this market.
The iShares Dow Jones U.S Energy (IYE) peaked at $50.56 (point c) in December, which was just below the 4th quarter projected pivot resistance at $50.62.
- IYE is now down 3.75% from its highs as it was hit
hard Monday and it is now below the 1st quarter pivot at $49.09.
- The uptrend from the August lows, line d, is now being
tested.
- There is next good support in the $48-$48.30 level,
which also corresponds to the September highs.
- The projected monthly pivot support is at $47.62.
- The daily OBV peaked in November and has formed lower
highs, line e.
- The OBV support (line f) has now been slightly broken
with longer-term support at line g.
- There is initial resistance in the $49.50-$50 area.
NEXT PAGE: Energy ETF & Stocks to Watch
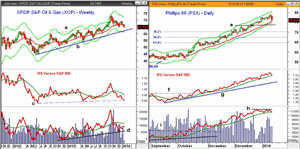
|pagebreak|The SPDR Oil & Gas Exploration ETF (XOP) hit its weekly starc+ band in October as it made a high of $73.76. It had broken through resistance, line a, in September.
- XOP opened the New Year below the quarterly pivot at
$68.85, which was a sign of weakness. It is now trying to hold above the
December lows of $64.27.
- The weekly uptrend, line a, is at $61.80 with the
weekly starc- band at $61.10.
- The weekly relative performance dropped below its WMA in the
first week of November.
- The RS line is now very close to breaking more
important support at line c.
- The weekly OBV did confirm the October highs before
reversing to the downside.
- The weekly support (line d) did hold in December so
this is now an important level of support.
- The daily OBV (not shown) is below its WMA but is also
still above the December lows.
- There is initial resistance now in the $67-$67.50
area.
Phillips 66 (PSX) is one of the top stocks in the Oil & Gas Refining & Marketing, up 26.5%, though Valero Energy Corp. (VLO) did even better as it is up 41.6%.
- The close Monday was the lowest in 2014 with next
support in the $73-$74 area, line e.
- The quarterly pivot and the 38.2% Fibonacci support are at $70.19 and $69.97
respectively.
- The 50% retracement support is at $67.18.
- The daily relative performance did confirm the highs
and has now pulled back to its WMA.
- The RS line staged a strong breakout in October as
resistance at line f was overcome.
- The RS line has more important support at line g.
- The daily OBV shows a slight negative divergence, line
h, and is now testing its WMA.
- The OBV also completed its bottom formation in October
as it overcame the resistance at line c.
What It Means: The technical outlook suggests that crude oil, as well as the iShares Dow Jones US Energy (IYE) and SPDR Oil & Gas ETF (XOP) can still move lower in January. I advised reducing long positions in IYE early in 2014 (Watch for Warning Signs) and the remaining position was stopped out Monday.
There are quite a few stocks, like Phillips 66 (PSX), which still look positive technically. The next rally in these stocks will be important as we will need to see if more significant tops are formed.
How to Profit: No new recommendation.
Portfolio Update: For iShares Dow Jones US Energy (IYE) was long from $46.32 and sold 1/2 at $49.81. The remaining position was stopped out at $48.83 on Monday.
Still holding a long position in Phillips 66 (PSX) from $56.04 though took additional profits at $72.56. Currently have a wide stop at $69.59.


