
Although last week’s market meltdown has some investors rattled, MoneyShow’s Tom Aspray anticipates a rebound this week and scouts around the globe for potential buy candidates.
The close last Friday could not come soon enough for most investors while traders bailed after the New York close, knocking the futures five points lower on the heaviest volume of the day.
The technical and sentiment readings have been in the moderately high-risk zone since before Christmas. Some of the bulls became disillusioned in early 2014 as the market moved sideways (Souring Sentiment Will Help Stocks), which made the market even more vulnerable.
The sentiment has shifted since last week as the selling was the heaviest in some time, with the declining stocks leading the advancing issues Friday by a 6.4 to 1 margin. The ARMs Index or TRIN, a measure of overbought/oversold market condition closed at 1.75 on Friday with its 10-day MA at the highest level since the late February 2013 lows.
On a short-term basis, this favors a decent rebound this week that could last a couple of days as many did not succumb to the panic selling in reaction to China’s manufacturing data. As discussed in Friday’s Weak Ahead column, I reviewed some of the past China-inspired market declines that eventually set up good buying opportunities. The overseas markets were lower early Monday but the futures are higher.
This market correction should not only eventually provide a buying opportunity in the US markets but also overseas some potential buy zones are evident on the weekly charts.
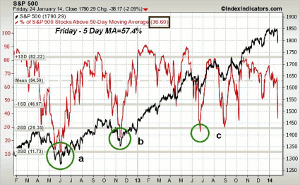
Click to Enlarge
Chart Analysis: The % of S&P 500 stocks above their 50-day MAs was just over 79% at the end of 2013.
- As I have noted over the past few months, it has formed lower highs since May, line 1.
- The % dropped sharply from just over 70% last Wednesday to 36.6% on Friday.
- At the June 2012 lows, the % dropped to well under 15%, point a.
- At the November 2012 lows (point d), the % dropped below 25%, which was more than 2 SD (standard deviations) below the mean of 64.59%.
- At the June 2013 lows, the % was also below 29%, point c.
- The five-day WMA more clearly identifies the turns as it did last June.
- It dropped to around 35% twice in 2013 and is still relatively high at 57.4%.
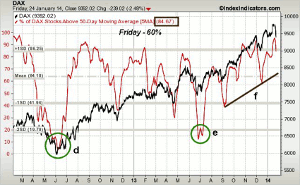
Click to Enlarge
The chart of the German Dax (also from IndexIndicators) shows the five-day MA over the past two years.
- The MA dropped to an extreme in June and July of 2012, line d.
- It rose for the next three months to over 90%.
- A strong surge into overbought territory like this is a sign of strength as the DAX rose from under 6000 to over 9750.
- Since that low, drops in the five-day MA to the 40% area have often marked short-term lows.
- Last summer, the MA dropped to 15% (point e), which was more than 2 SD below the mean.
- The MA shows a pattern of higher lows, line f, with support in the 64 area.
- The five-day MA is currently at 84.67% as the % dropped to 60% on Friday.
- On a one-day basis, the % dropped to below 10% last summer.
NEXT PAGE: ETFs to Watch
|pagebreak|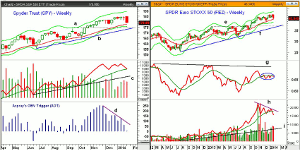
Click to Enlarge
The Spyder Trust (SPY) shows the weekly LCD sell signal last week with the 20-week EMA at $177.56, which is just below the quarterly pivot at $177.84.
- The weekly starc - band is at $175.52 with the September high, line a, at $173.60.
- The weekly uptrend, line a, is just slightly lower.
- The weekly on-balance volume (OBV) did make a slightly new high two weeks ago and is not testing its rising WMA.
- The longer-term OBV support is much lower at line c.
- Aspray’s OBV Trigger (AOT) peaked in November and has been forming lower highs, line d.
- The fact that the OBV did confirm the highs makes the current OBV decline look like a buying opportunity and the AOT could give a bullish trigger in the next few weeks.
- There is resistance now at $180.50-$181.32 and stronger at $182.76.
The SPDR Euro STOXX 50 (FEZ) is made up of the largest Eurozone companies. It has 38% in the top ten holdings with a yield of 2.75% and an expense ratio of 0.29%.
- FEZ is currently 5% below the highs at $42.43 as it closed last week below the quarterly pivot at $40.99.
- The 20-day EMA is at $39.96 with the quarterly projected pivot support at $39.54.
- The weekly starc- band is at $38.73 with more important weekly chart support at $36.90, line e.
- From the June 2012 lows, the FEZ was much stronger than the S&P 500.
- That was also the case from June 2013 through November.
- Recently it has kept pace with the S&P 500 (see circle).
- The weekly OBV peaked in October and has since formed lower highs, line h.
- The OBV dropped below its WMA, which has started to flatten out.
- The OBV shows a long-term bullish pattern.
- There is strong resistance and a gap in the $41.16 to $42.00
What It Means: The strength or weakness of a rally this week may help us determine how long the market decline or correction may last. I would recommend you keep an eye on the quarterly pivot levels for the key ETFs (see table) as those that hold these pivots on a weekly closing level may be the new leaders.
Some of the country ETFs that are looking the best are the iShares MSCI Austria (EWO), iShares MSCI Spain (EWP) and iShares MSCI Italy (EWI). I think the SPDR Euro STOXX 50 (FEZ) could drop down to the $38.50-$37.00 area.
How to Profit: No new recommendation for now but watch my Twitter feed for intra-day market updates.
Editor’s Note: If you’d like to learn more about technical analysis, attend Tom Aspray’s workshop at The Trader’s Expo New York, February 16-18, 2014. You can sign up here, it’s free.


