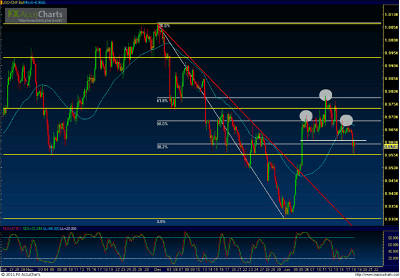
Price action on USD/CHF (a four-hour chart of which is shown) as of Tuesday (Jan. 18) dropped down to key 0.9550 support.
(Price on first pane, Slow Stochastics on second pane; horizontal support/resistance levels in yellow; uptrend lines in green; downtrend lines in red; chart patterns in white; 50-period simple moving average in light blue.)
This occurs after the pair just formed a head-and-shoulders pattern and broke down tentatively below the neckline of the pattern.
The “head,” or the very top of the pattern, resides around the 61.8% Fibonacci retracement of the one-month bearish run from the 1.0060 high in the beginning of December to the 0.9300 record low at the very end of 2010.
In the event of a strong further breakdown below the noted 0.9550 support area, price action could begin targeting further downside support around the key 0.9300 extreme low once again.
By James Chen, chief technical strategist, FX Solutions


