Walker England of DailyFX.com explains how to use the RSI indicator to find profitable currency trades, along with entry and exit points.
In between times of market volatility, traders may find extended periods where currencies are trading sideways. These periods are defined as a ranging market and seen on the graph as trading between established levels of support and resistance.
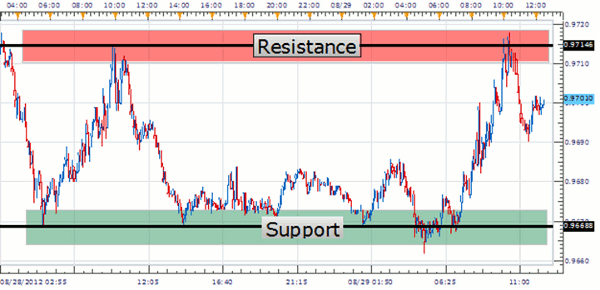
Below we can see an example of a defined 46-pip range on the CAD/CHF currency pair. Our pertinent price points include resistance at current highs near .9715 and support at a price level near .9669. With these areas defined, we can then proceed with a trading plan to trade these pricing levels. For this, we will once again turn to the RSI oscillator.
RSI can be utilized when the markets are in a trend. But the truth is, that RSI can be used just as well in a range.
In a ranging market, we want to time our entries when support/resistance points line up with RSI and overbought/oversold conditions. Timing is key, and we can see on the graph below that the previous trading signal allowed us to sell resistance as RSI moved from overbought levels. As price declines, traders can look for a fresh signal to buy the CAD/CHF at support if RSI becomes oversold.
The great thing about ranging markets is that you do not have to have a specific market or trend bias. Traders have the ability to trade the range until price breaks out from support and resistance levels. Due to the possibility of a breakout, range traders can use half the distance of the current range to assess potential stop levels. In this example, traders would look to keep a minimum stop of 23 pips from their point of entry.
Using the RSI with the chart mentioned above, my preference is to buy the CAD/CHF on a return from oversold levels near .9668 or better. New orders can target range resistance at .9715, with stops placed outside of support as described above. Depending on where RSI creates a signal to buy, traders can then extrapolate a 1:2 or better risk-reward level.
Next: Another example of using RSI
|pagebreak|Here’s another example of using RSI as a tool to find a good trade. The EUR/AUD has been one of the market's dominant trends, declining 6,010 pips from its 2008 high. Most recently, the pair has pressed to all-time lows at 1.1604, dropping another 1,419 pips from its May high of 1.3029. With prices on the EUR/AUD pointing considerably downward, trend traders should have a preference to sell.
Even though we know we are looking to sell, it can be difficult pinpointing an opportunity to enter into the market. To help with this, indicators know as oscillators can be employed to spot prospective trades. Let’s focus on using RSI in conjuncture with the EUR/AUD downtrend.
Now that the trend has been established to the downside, we can start looking for overbought and oversold levels by applying RSI to our daily chart below. Using RSI with the traditional 14-period setting is a great tool for this purpose, as it is designed to find pullbacks against the trend using overbought and oversold levels.
Traders in this example will wait for a pullback causing RSI to read over 70, and execute as momentum begins to head lower. Circled below, we can see four previous examples of this occurrence on a daily chart.
It is important to notice that RSI is not currently in overbought territory. With a reading of 63, traders are still waiting for a candle close to bring the indicator over 70 before considering new sell entries. Once 70 has been reached, traders can prepare for execution when the indicator moves back below these levels.
Using the RSI with the chart mentioned above, my preference is to sell the EUR/AUD on a turn from overbought territory. Entries can target fresh lows for profit targets under 1.1610 or better. Depending on where RSI creates a selling signal, traders can then extrapolate a 1:2 or better risk-reward level.
Walker England is a trading instructor for DailyFX.com.


