In these days when the euro is looking for direction, when big banks have different points of view and targets, James Chen provides his outlook on the majors.
Chen covers the EUR/USD, GBP/USD, USD/JPY and USD/CHF and provides his opinion on how the majors will do in the next three months; trends, performance, levels to take into account, and more.
EUR/USD
EUR/USD (a daily chart of which is shown) has displayed a clear and strong downtrend since the 1.4937 high in May of 2011. This bearish trend accelerated even further to the downside after the lower 1.4547 high was established in August of 2011. After price began to drop swiftly from that pivot high, this currency pair took only around 11 months of accelerated bearishness to drop a substantial 2500+ pips down to establish a new 2-year low of 1.2041 in July of this year. Since July’s low, price has climbed back up in a sharp bullish correction that has broken out above several key levels, including 1.2600, 1.2800, and the important 1.3000 resistance level.
After this breakout above 1.3000, EUR/USD was only able to climb up to key resistance at 1.3170 before exhausting its short-term bullish run and pivoting back to the downside in what could eventually be an attempt to re-assert the long-term bearish trend. With the current re-breakdown below the important 1.3000 psychological level, price appears potentially poised for further losses in the short-to-medium term. With any further breakdown below current support around the 1.2800 level, the pair could look once again to a bearish trend continuation by moving towards the 1.2000-1.2050 support region.
Key upside resistance within the current bearish trend may reside around the 1.3150-1.3170 price region.
GBP/USD
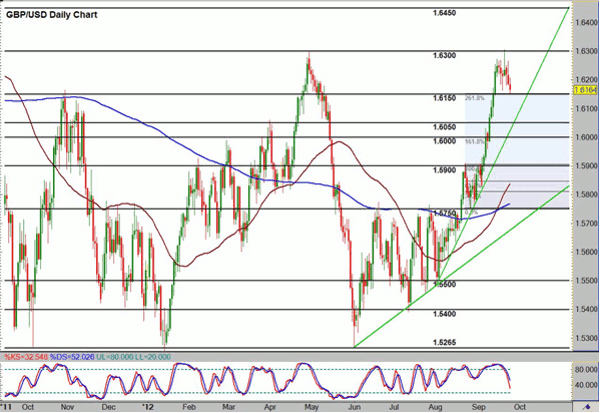
GBP/USD (a daily chart of which is shown) has displayed a steep uptrend since the August low just below 1.5500. The complete uptrend extends further back to the June low of 1.5265. After rising sharply from those lows within the last several months, breaking above several key prior resistance levels including 1.5750, 1.6000, and 1.6150, price rose further to hit the important 1.6300 resistance with a shooting star candle. Pivoting back down off that bearish candle pattern, effectively respecting the 1.6300 resistance and establishing a new 21-week high in the process, price has retreated to approach the key 1.6150 level again, this time as support. This retreat potentially represents an exhaustion of the strong upside momentum that had been displayed in the last couple of months.
NEXT: What’s ahead for USD/JPY and USD/CHF?
|pagebreak|In the event of a strong breakdown below the 1.6150 support region, price action could look towards extending the current bearish correction by moving towards the key 1.6000 level once again, thereby potentially placing the current bullish trend in jeopardy. Resistance to the upside may continue to reside around the 1.6300 level. Any breakout above that level could confirm an uptrend continuation with a bias towards further resistance around the 1.6450 level.
USD/JPY
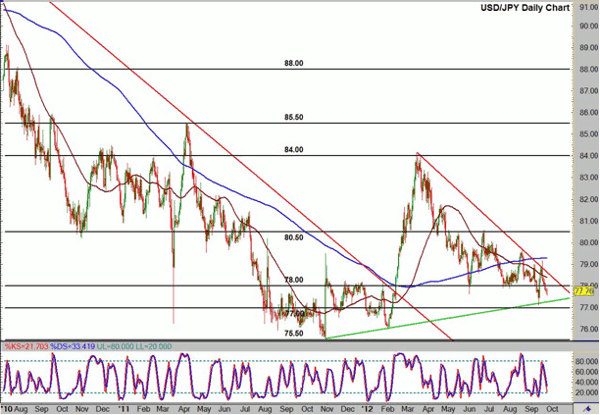
USD/JPY (a daily chart of which is shown) has displayed a general bearish trend since the highs around 84.00 resistance in March. Despite this bearish trend, price has since experienced much sideways trading range price action, especially between the 80.00 and 78.00 levels. The overall trend bias continues to be to the downside. Downward price momentum is approaching a key uptrend support line extending back to the October 2011 lows near 75.50. In the event of a breakdown below that trend line and a subsequent breakdown below the 77.00 support level, the market bias would potentially be towards the key 75.50 level extremes once again.
To the upside, a strong breakout above the current downtrend resistance line could disrupt the current downtrend, potentially with a bias towards strong upside resistance around the 80.50 level.
USD/CHF
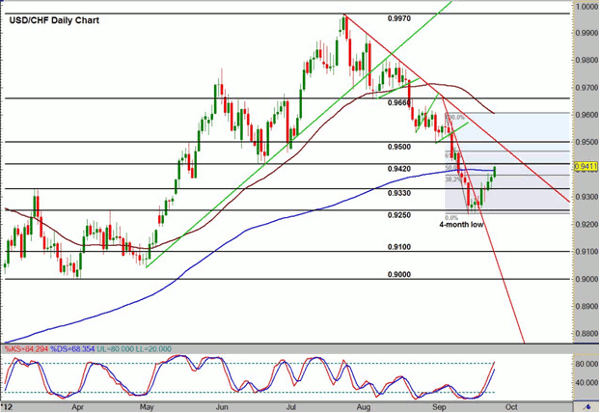
USD/CHF (a daily chart of which is shown) has displayed a sharp and accelerated bearish trend since the July highs at 0.9970, near parity. This downtrend broke down below successive key support levels including 0.9660, 0.9500, 0.9420, and 0.9330. The sharp drop within the last few months finally met strong support around the key 0.9250 price region, where a new 4-month low was established in mid- September. Since the downtrend’s slow down around 0.9250, price has made an upside correction within the last week to re-breakout above the 0.9330 level, this time as resistance. The current market bias within the strong bearish trend continues to be to the downside, despite the current minor correction. With upside resistance currently residing once again around the 0.9420 price region, any strong short-term breakdown below the key 0.9250 support level would confirm a bearish trend continuation potentially with a bias towards the important 0.9000 support level. In the event of a short-term breakout above 0.9500 resistance, the current downtrend could be placed in jeopardy with potential reversal implications.
James Chen, Chief Technical Strategist, FXSolutions.


