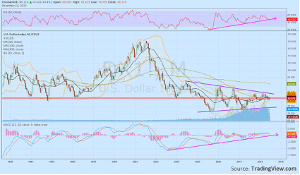
Technician Greg Harmon of Dragonfly Capital takes a look at the US Dollar Index from a longer perspective, with the intent of helping to create a high-level road map for the next 12 months and beyond.
The US Dollar Index is a composite of the how the US dollar looks compared to six major currencies on a trade-weighted basis. It has the heaviest weighting to the euro at over 55%. The Japanese yen, British pound, and Canadian dollar make up over a third of the remaining value. The Federal Reserve began calculating it in 1973 after the country moved off of the fixed exchange rate system that had been established at the meetings at the Mount Washington Hotel in Bretton Woods, New Hampshire, known as the Bretton Woods Accord. It is a pretty cool hotel and worth a visit outside of its historical significance.
The Index had some significant moves early on, but from the monthly chart below, it has been very stable lately. Let me say that again. It has been very stable lately. Despite all of the quantitative easing. The Index had a spike up to 120 in 2002 but since then has reverted to the 80 level where it had found support during most of the 1990s. Since 2005, it has been tightening its range around 80 in a symmetrical triangle. The triangle is coming further into the apex and the range has tightened significantly since the start of 2012, to a range of only about seven points between 78 and 85.
During this time the relative strength index (RSI) and MACD have slowly been gaining strength as it has been favoring the top of the triangle. The prognosis going forward looks like more of the same and the momentum indicators suggest that if there is a change it more likely to happen to the upside. A break of that triangle over 84.50 to the upside would carry a target of 104.50. This strengthening of the dollar would likely all else being equal hurt stock prices so it is worth looking to see if there are shorter-term catalysts that could trigger it.
The weekly view poses a potential scenario. With the double top (in red) complete, the Index pulled back to the bottom of the long triangle and then bounced. It has been in a slowly rising channel since the start of 2012 as it currently is looking to head toward the bottom of that channel.
Should it bounce there, the next touch at the top of the channel is likely to take it over the top rail of the triangle at 84.50 should that not provide resistance. For the short run, the Index looks better to the downside though with both the RSI and MACD supporting the current price action lower. A move under 79 sets up a trade opportunity to the bottom rail support of the triangle at 74.25. Drilling down further to the daily chart shows the current downtrend as a channel with the Index near the top and reversing back higher. The RSI is also rising but the MACD still heading lower. The channel is now the key to focus on. Should the Index break the channel to the upside and move over the 81-81.50 area then the upward price action discussed above comes into play. But if the top rail of this channel holds and it falls back toward the bottom of the channel, then the 79 level that triggers much greater downside comes into play.
C3
So the key for strength in the dollar is a short-term move over 81.00-81.50 leading to 84.50 and a break above that higher. That is the worry point for US equities. The downside story takes control on a failure short term at 81 and reversion to 79 and below leading to a target of 74.
By Greg Harmon of Dragonfly Capital


