The weekly Commitment of Traders (COT) report, though linked to the futures markets, can be used as a source of valuable trading data for traders in all markets, including equities and currencies.
Each time I write one of these MoneyShow.com articles, I like to offer some practical and hopefully insightful slices of information to help the trading journey go smoother. This week, I am in my final leg of a mini-tour of the United States, having been welcomed warmly to teach a futures class in the beautiful surroundings of Denver, Colorado.
As we approach the fourth day of what has been a delightful and energetic class, I wanted to share a little look into a topic we covered today as a little extra to the already packed curriculum: namely, the Commitment of Traders (COT) report.
Now while the COT report may be directly linked to the futures market, it can still be used as a highly useful resource for forex trading as well, especially for currency traders who like to engage in regular trading activity on the likes of the major pairs like EUR/USD, GBP/USD, and AUD/USD.
In fact, the COT report can be used for any of the major dollar-based forex pairs, and even the US dollar index itself, as these pairs are all available to trade as liquid futures contracts which directly mirror their spot market counterparts, while the dollar index futures which trade on the Intercontinental Exchange (ICE) parallel the cash dollar index.
Unfortunately, we do have to exclude the cross pairs like the GBP/CAD or EUR/JPY, as these pairs do have futures contracts, but they are highly illiquid, and therefore, are not ideal to actively trade.
Before we look into how we can use the COT report, we should understand what it is. Firstly, the Commodity Futures Trading Commission (CFTC) releases a new report every Friday at 3:30 ET, and the report reflects the commitments of traders on the prior Tuesday.
The weekly report details trader positions in most of the futures contract markets in the United States. Data for the report is required by the CFTC from traders in markets that have 20 or more traders holding positions large enough to meet the reporting level established by the CFTC for each of those markets. This data is gathered from schedules electronically submitted each week to the CFTC by market participants listing their position in any market for which they meet the reporting criteria.
The report provides a breakdown of aggregate positions held by three different types of traders: commercial traders, non-commercial traders, and non-reportable. Commercial traders are sometimes called hedgers; non-commercial traders are sometimes known as large speculators; and the non-reportable group is sometimes called small speculators.
As we would expect, the largest positions are held by commercial traders that actually provide a commodity or instrument to the market, or have bought a contract to take delivery of it. Thus, as a general rule, more than half the open interest in most of these markets is held by commercial traders.
There is also participation in these markets by speculators that are not able to deliver on the contract, or that have no need for the underlying commodity or instrument. They are buying or selling only to speculate that they will exit their position at a profit, and plan to close their "seller" or "buyer" positions before the contract comes due.
In most of these markets, the majority of the open interest in these speculator positions is held by traders whose positions are large enough to meet reporting requirements. The remainder of holders of contracts in these futures markets—other than commercial traders and large speculators—are referred to by the CFTC as non-reportable. This is because they don't meet the position size that requires reporting to the CFTC, thus making them the small speculators.
The non-reportable open interest in a futures market is determined by subtracting the open interest of the commercial traders plus non-commercial traders from the total open interest in that market. As a rule, the aggregate of all traders' positions reported to the CFTC represents 70%-90% of the total open interest in any given market.
NEXT: How to Read and Interpret COT Data
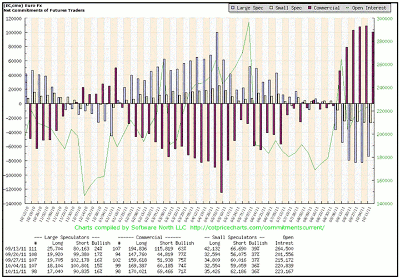
|pagebreak|If you do a search for the COT report online, you will easily find a link to it. If you are having trouble, then you can always check the CFTC Web site for more information. Typically, a COT report looks something like this:
The above illustration shows the net positions of the three groups as designated by the legend in the top right of the chart. The green line is the change in the open interest. Please be aware, however, that it is normal to see regular dips in the open interest line around expiry and rollover of futures contracts as traders close out their positions only to reopen in the next contract month.
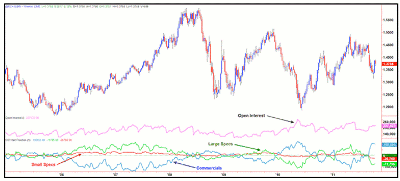
If you are a TradeStation user, you can also get a hold of this same COT information as an indicator built into the platform (but you will need the necessary futures feed to access it. It looks something like this:
Personally, I find this to be highly useful for comparing the COT directly with the chart of the pair itself, which in this case is the EUR/USD futures.
I pay particular attention to the change in open interest by using a simple logic in conjunction with my price action analysis of trend and supply and demand. For example, we can interpret the changes in open interest in the following manner:
- If price is rising and open interest is rising, the market is getting stronger
- If price is rising and open interest is falling, the market is getting weaker
- If price is falling and open interest is falling, the market is getting stronger
- If price is falling and open interest is rising, the market is getting weaker
While it should be noted in advance that the COT report is lagging in nature, it does offer the disciplined trader an insight into the behavior of the key market speculator groups and can be used as a complementary analytical tool for the longer-term position trader and swing trader alike.
While the data may be generated from futures market activity, it can easily be used as a reflection of what to expect in the spot forex arena, too, as both markets trade in line with one another.
Remember that technical analysis is more of an art than a science, especially when we incorporate the use of indicators like the COT, but if they are used in a disciplined manner alongside a solid and detailed trade plan, they can become a useful tool in the competent market speculator's tool bag. I hope you found this useful.
By Sam Evans, instructor, Online Trading Academy


