Greg Harmon of Dragonfly Capital explains how several charts of Priceline may be pointing to higher highs for the stock.
Based on its latest TV commercial with a crashing bus, it seems that William Shatner was a weight on Priceline’s (PCLN) stock price. No sooner does he die in a fiery bus crash than the stock heads higher and breaks a consolidation zone. Lets take a look.
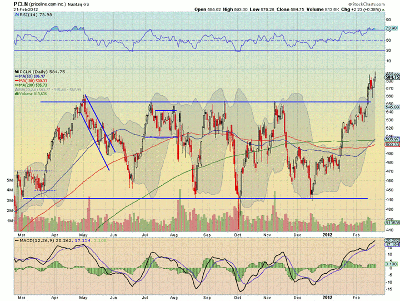
Here is a daily chart:
PCLN had been in that consolidation channel for nearly a year between 440 and 550 before breaking above it last week. Long enough that all of the simple moving averages (SMA) were flat.
As it rides higher, the 50-day SMA has crossed up through the 200-day SMA, the Golden Cross, and the relative strength index (RSI) is bullish if a tad bit overbought, but not excessive. The Moving Average Convergence Divergence (MACD) indicator is also positive, adding to the bullish sentiment.
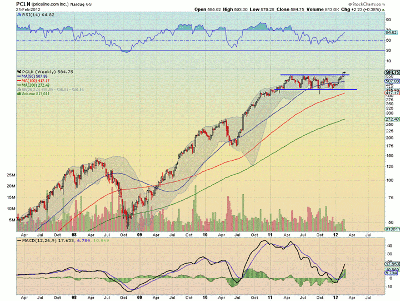
The first target for a break over this channel is to 660. It will likely not happen in a straight line, though. The weekly chart shows the true bullish picture, that consolidation zone, after a run higher from 175, is also a bull flag and the break out higher triggers a measured move to 815.
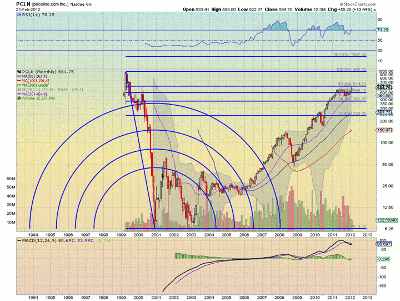
Here is a longer-term daily chart:
On this timeframe, the bottoming and now rise of the RSI is apparent. It is bullish and trending higher. The MACD is also building.
The volume is increasing on a relative basis on this entire leg higher, although still below that experienced last year. But backing out to the monthly view gives an even more bullish perspective.
If this stock can get over the 61.8% Fibonacci retracement of the major move lower from 1999 into 2000, then there is little in the way of a full retrace up to 990. That is a long way from the current 584.
If you are a short-term trader, be aware that it reports earnings on February 27, next Monday.
Greg Harmon can be found at Dragonfly Capital.


