As we head into the final trading days of the year, WaveTrading.com gives us a glimpse into what the Elliott Waves are saying about the short-term outlook for the market.
As I suggested yesterday:
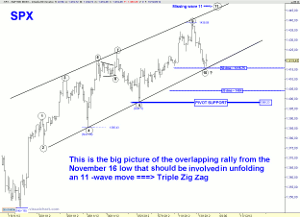
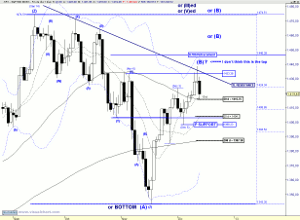
"My view is that price has not completed yet the Triple Zag off the November lows, instead price has began a pullback wave (B) of the third Zig Zag that should bottom in the range 1416-1410 from where I expect the kick off of the last wave (C) up of (Z). In other words we should have the usual Santa rally into year end. If price breaches the pivot support at 1398.23 I will reassess the short-term bullish scenario."
My bullish bias is based upon an uncompleted EW count of the up leg from the November 16 low, since I am considering that price is unfolding a Triple Zig Zag = 11-wave move.
If this count is correct and price maintains intact the outlined rising channel of the 60-min SPX chart, which I attach below, then we are very close to a potential reversal.
Keep in mind that at yesterday's lod price tested the important support of the 50 dma.
If this area does not hold, then price should continue the current corrective pullback towards the next support located at the 20dma = 1404.
I will not modify this count as long as bears do not achieve an eod print below the pivot support at 1398.23.
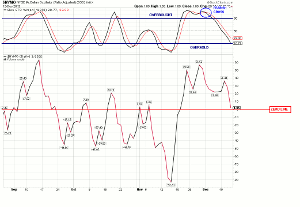
As you know, in addition to EW counting, I always follow the indications that come from breadth and momentum indicators.- The McClellan oscillator gave a warning of a pending pullback with its bearish cross of the stochastic from an overbought reading. Now the stochastic is approaching the oversold zone and the oscillator is reaching the zero line. If SPX has not completed the "overlapping" move from the November lows then the McClellan oscillator should not lose the zero line (2 consecutive eod prints below would be a warning that something more bearish might be cooking).
Recall that if there is pending wave (c) up, then I want to see negative divergences in order to consider feasible an important top.
NEXT PAGE: Mixed Signals
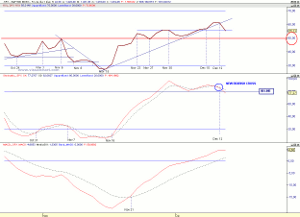
|pagebreak|- The momentum picture is more bearish friendly since Thursday the stochastic issued a new sell signal and lost the 80 line, but the line in the sand is the RSI 50 line.
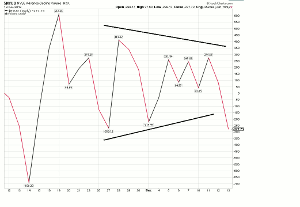
Maybe it might be anecdotal, but I see a thrust down out of a contracting pattern. Usually this occurs at the end of a move.
Neither the daily candlestick gives me too many bullish vibrations. If bulls fail at Thursday's lod then as we can see in the daily SPX chart below, odds would be very large that price should easily drop towards the next critical support located in the area of 1404.
If price confirms my short-term scenario, then the potential top for the assumed wave (B) (Under the scenario that the corrective pattern from the September high is not over yet) can be located at the 0.786 retracement = 1446, in which case price will not breach the channel I have outlined in the SPX 60 min chart.
We also have as an indication the potential extension 1 x 1 of 40.36 points of the previous up leg.
So as long as bears do not inflict a serious technical damage by reclaiming the pivot support at 1398, in my opinion, this pullback will eventually be bought.
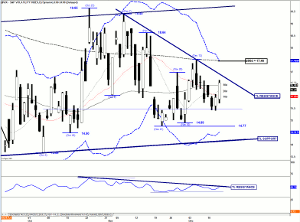
Mr. VIX, as it is usually the case, when the market is approaching a potential turning point, should give us valuable clues. Here we have a clear trend line resistance both for the "fear" index and its RSI + the 200 dma that will dictate on the market behavior. Usually we should see the VIX Index at the upper Bollinger Band when a major top can be established or at the lower Bollinger Band when price is involved in a bottoming process. Now we are more or less in the middle of the range.
For the longer-term time frame, if VIX remains constrained between the two converging trend lines, then a large move should be expected maybe during the month of January.
The US fiscal cliff "farce" will most likely hold the kick-off to the Santa rally until an agreement is reached. In addition this week we have Quarterly OPEX, which always adds uncertainties on the short-term pattern.
But I guess that end-of-year repositioning + PPT + Santa will eventually favor the bulls.

