

Designed for swing traders, the staff at Briefing.com puts together a list, which features daily set-ups for names in their proprietary Focus List of the 50 strongest, most liquid stocks in the market today.
The end of the year is drawing near, so the activity in stocks tends to be more erratic. For the most part, seasonality suggest an underlying bullish bias, but we still should not ignore the signals on the charts. The market itself is stuck between a "rock and a hard place" as all the major indices are challenging their respective 50-day moving averages as resistance in some shape or form. We need to be particularly careful with leaning too aggressive long or short at this juncture.
Chart Analysis
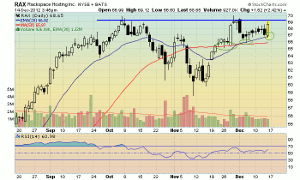
RAX - Price began to show promise of holding its 20-day EMA support along the 66.75 area. RAX was ranked #1 on our Focus List until this week (now #2), which means it should respond very well to bullish technicals. No need to complicate things with overbought/oversold indicators or divergences...just identifying key price zones (support/resistance), trendlines, and moving averages.
Note how RAX recouped its 50-day MA after the mid-November correction, followed by a late-month surge back up to the October highs. Price pulled back in early December only to hold its 20-day EMA, which had just crossed back above its 50-day SMA (a bullish crossover). Today, price bounced almost immediately off its 20-day EMA on its opening reversal and caught bids during the afternoon. This keeps the stock on the radar next week as a potential breakout candidate above three-month resistance along 69/70 area, into new-high ground.
Click to Enlarge
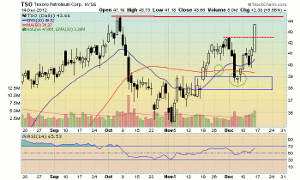
TSO - A leading energy refiner that caught a breakout today to a fresh 2-1/2 month high over 42.50, eyeing its October highs near 44. This was one of my recent swing long picks on our Briefing Trader service back on Dec 6 just below 39. There were a few things I liked for this as a buying opportunity. First, price was in the midst of a three-day pullback. The 3rd day (Dec 5) was a wide range bar down, closing under the 50-day MA. Normally, that's a "red flag," but I liked the fact this was the first pullback after its 20-day EMA had crossed above its 50-day SMA, which is often very bullish. I also like the mid-November bullish gap around the $38 area acting as "new support." Seeing price rally higher the next two days over $40 was confirmation of the bullish set-up. We took another partial profit into today's strength above 43 for a +4 gain.
Click to Enlarge
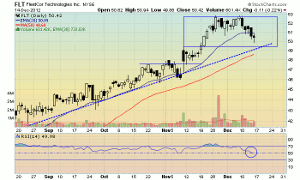
FLT - This leader had slipped into more of a range-bound/pullback the last week or so, but still looks really strong in context of its bigger picture uptrend. RSI-14 is dipping back to the 50-midpoint, which typically can act as a decent buying opportunity in strong uptrends. Watch for FLT to resume higher next week, with potential to move back up to the Nov/Dec highs near 52/53. Key support below is along the rising 50-day MA's.
Click to Enlarge
NEXT PAGE: The 50 Most Liquid Stocks
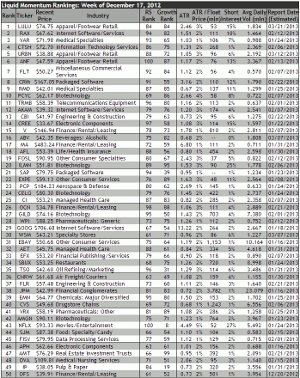
|pagebreak|Liquid Momentum Rankings
With equity markets always in motion and leadership rotating from one group to another, this list is designed to help active day and swing traders stay on top of the highest-quality trading names. It is generated from a proprietary algorithm that places heavy emphasis on superior relative strength versus the all stocks universe, high average true range (ATR) values, and high average daily volume, among other data points. An updated list is published each Monday, along with charts and commentary throughout the week highlighting the most compelling set-ups and patterns.
ADDITIONS: ABV, AEY, APH, CHRW, CVS, PCYC, V
DELETIONS: EV, PCLN, QCOM, SWI, TEVA
Click to Enlarge
Liquid Momentum is Briefing.com's proprietary Focus List for the 50 most liquid, high relative strength stocks in the market that are ideal for day and swing trading candidates.
By the Staff of Briefing.com


