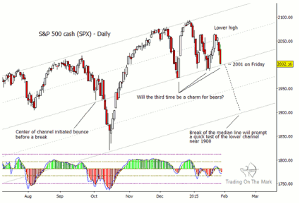
Charting the S&P 500 index, the staff at Trading On The Mark, highlights three times-over the past two years-that the center line has been breached, how the market responded each time, and why the present area is crucial for deciding the market's tone going into February.
Most of the major stock indices around the globe are signaling that the bear might be scratching at the door. Our chart of the S&P 500 Index (SPX) shows why the present area is important for deciding the market's tone going into February. A breakdown from here could be the start of something much larger.
For two years, SPX has recognized the channel we have drawn on the weekly chart below. You know a channel is meaningful when the market responds not only to the channel's boundaries, but also to fractional multiples (harmonics) of the channel width. In the weekly chart shown below, note how price responded to the initial breach of the center line in October.
In December and January, SPX has encountered the center line two more times and is now on the verge of a third test. This is not a pattern one should see if there was still much appetite for buying, especially with price coming down from a lower high.
If SPX breaks decisively through support (estimated to be near 2,002 at the end of the current week), then the most likely near-term target will be the lower edge of the channel. Depending on time, that could put the index near the 1,900 level in February.
By the staff at Trading On The Mark


