
Chinese New Year has given rise to the year of the Water Dragon, a period that throughout history has been especially bullish for the Dow and S&P 500.
Last week, Asian brokerage firm CLSA Asia-Pacific Markets published its CLSA Feng Shui Index (CLSA FSI), a “Tongue-in-cheek look at what’s in store for the Hang Seng, key market sectors” for the coming year.
I have had the pleasure of speaking in many of the Asian financial centers and have analyzed their markets for many years, and as such, I have always looked forward to this report. This year, it is of particular interest.
The Chinese Zodiac is comprised of 12 periods, each identified by an animal, and each associated with an element. The elements are wood, fire, earth, metal, and water.
For those who are not familiar with the Chinese Zodiac, this is the year of the Water Dragon. (To find your Chinese Zodiac sign, please click here.)
The last time the sign of the Water Dragon appeared was in 1952, which, like 2012, was an election year. President Eisenhower was elected in November 1952, and the exact Chinese Zodiac dates from that year were January 27, 1952 through February 13, 1953.
During this period, the Dow Industrial Average was up 3.6%, but as charts below will indicate, it was an exciting year.
Since 1952, there have been four other Dragon years as part of the 12-year cycle. The average for the five years is a gain of 5.8% using the Dow Industrials before 1980 and the S&P 500 in later years.
The Water Dragon year in 2012 runs from January 23, 2012 through February 9, 2013. On Monday, January 23, the S&P 500 opened at 1315.29. An average Dragon-year gain of 5.8% in 2012 would mean that the S&P 500 would close on February 9, 2013 at 1391.57.
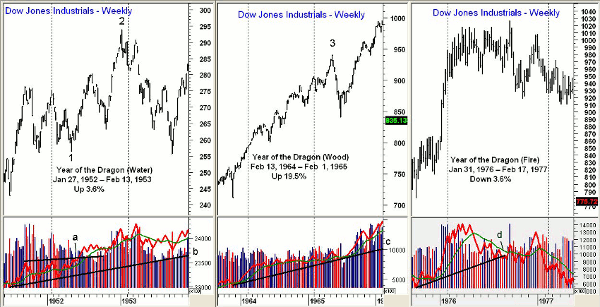
Click to Enlarge
Chart Analysis: The Dow Jones Industrials started the 1952 year of the Water Dragon at 273.7 before declining to a low in May of 256.3. This was a decline of 6.4%.
- Stocks rallied sharply from that point, peaking in early January 1953 at a high of 293.8, point 2
- The Dragon year ended with the close of 283.1, which was a gain of 3.6% for the year
- We also have on-balance volume (OBV) data available for this period even though Joe Granville had not yet come up with the concept. The OBV broke out through resistance, line a, in May 1953, signaling stocks’ strong surge
- The OBV showed a strong uptrend through the middle of 1953, line b
- The Dow Industrials peaked in early 1953 at 293.8 and had declined to 283.1 at the end of the Dragon year
- Stocks remained weak for most of the year, eventually dropping to a low in September at 259.70
The Wood Dragon ran from February 13, 1964 through February 1, 1965. As the chart indicates, this was a very strong period for the stock market.
- The Dow Industrials started the year off at 794.60 and ended the Dragon year on February 5, 1965 at 901.6. This was a gain of 19.5%
- The weekly chart shows a very solid uptrend with a series of higher highs and higher lows
- The on-balance volume was acting very strong at the beginning of the period and shows a very solid uptrend, line c, through 1966
- The Dow continued higher in 1965 reaching a high of 939 in May before plunging to low of 840 in July
- The Dow then resumed its uptrend, hitting a high in February 1966 at 995.10
The year of the Fire Dragon lasted from January 31, 1976 through February 17, 1977 and followed the severe bear market low in 1974.
- As the chart indicates, it was basically a trading range year with the Dow Industrials starting at 975.3, hitting a high of 1026 in September, and finishing the Dragon year at 940.3. This was a decline of 3.6%
- The weekly OBV broke its uptrend, line d, in August, and failed to confirm the September highs
NEXT: Past and Future Trends in the S&P 500
|pagebreak|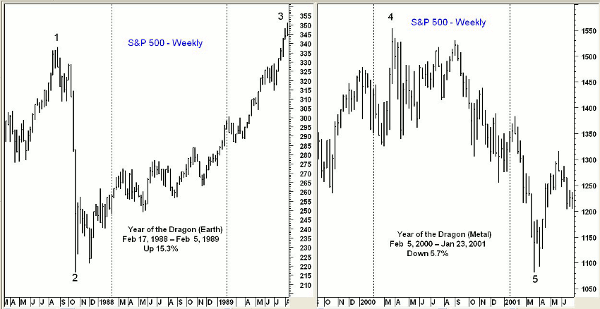
Click to Enlarge
Switching to the S&P 500, the Earth Dragon lasted from February 17, 1988 through February 5, 1989. This was just after the precipitous drop from the August 1987 high of 337.90 to the October 1987 low of 281.5.
- The Wood Dragon year started at 257.60 and ended at 297.00
- This was a gain of 15.3% based on the S&P 500. As the chart indicates, the S&P continued to move sharply higher the following year. It formed a double top in 1989 and early 1990, making a high of 360.6
The Metal Dragon year ran from February 5, 2000 through January 23, 2001 and included the Nasdaq Composite’s all-time high that occurred in March 2000.
- The Metal Dragon year started with the S&P 500 at 1424.40. It then rallied to a high of 1553.10 in March 2000
- Even though the September rally approached the prior highs with the S&P 500 reaching 1530.10, the rest of the year was on the downside
- The S&P ended this Metal Dragon year at 1343.5, which was a decline of 5.7%
- Of course, the S&P 500 made a final bear market low in October 2002 at 768.60
What It Means: It is also interesting to note that February 8, 1940 to January 26, 1941 was also a Presidential election year and a Metal Dragon Year. The Dow Industrials were up 12.8% during that period.
The CLAS FSI forecast does say “In terms of the Zodiac signs, a ‘fab’ year lies ahead for those born in the years of the Rat, Tiger, Rabbit, Monkey, and the Rooster; while Cows and Dogs may need to take a little extra care.
Though I am not a true believer in astrology, studying the historical charts of the financial markets has revealed many repeating patterns, which gives me further confidence in this analysis. (Also, while writing this article, I discovered that I was born in the year of the Tiger.)
How to Profit: The intermediate-term outlook for the US stock market is positive, as the Advance/Decline (A/D) line continues to make new highs. If the A/D line started to diverge from prices, that would change the outlook, so stay tuned.


