Ominous technical signals seen in these four stocks serve as potential red flags that the companies’ upcoming earnings reports could surprise to the downside.
Even though the majority of reporting companies have beaten analyst estimates, there have been quite a few stocks that have come under heavy selling pressure after their earnings reports were released.
As I discussed in detail on Friday, the stock market still looks vulnerable, and a sharply lower close on Monday would increase the odds of a deeper correction.
Stock index futures are very weak in early trading, so Monday’s close will be quite important. There is a flood of new earnings reports coming this week, and stocks that are acting technically weak are even more vulnerable if earnings disappoint.
As discussed in last week’s Trading Lessons article, there are several technical tools that can be helpful in identifying stocks that may drop sharply in reaction to earnings reports. Here are four stocks that from a technical perspective should be watched closely this week.
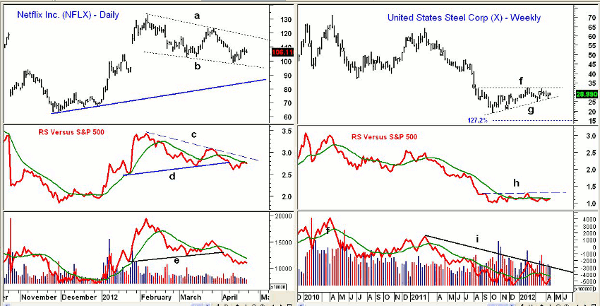
Chart Analysis: Netflix Inc. (NFLX) has rebounded over the past week, but the daily chart shows that the flag formation from the January highs, lines a and b, is still intact. NFLX will report earnings after the close on Monday, April 23.
- The 50% support using the rally from the October lows at $98.52 has held so far
- More important 61.8% support is at $90 with the daily uptrend (line c) at $85
- Daily relative performance, or RS analysis, broke support, line e, in early April, which confirmed a new downtrend. There is resistance at line d
- Daily on-balance volume (OBV) is acting even weaker and has dropped below two-month support, line f. It is well below its declining weighted moving average (WMA)
- Short-term resistance is now at $109.70-$111.60 with the daily downtrend, line a, at $118.50
The weekly chart of United States Steel Corporation (X) shows the well-defined downtrend from the 2010 high at $70.95. Since the October lows at $18.85, the stock has been trying to rebound. US Steel will report earnings on Tuesday afternoon (April 24).
- A bear flag pattern appears to be forming (lines a and b), and the rally was not even able to test the short-term 38.2% retracement at $36
- Initial support is at $26.39, which is the April low, and further support stands at $24.78. A completion of the flag formation has a 127.2% Fibonacci price-projection target at $15
- The weekly RS line has stayed in a narrow range, as X has just been keeping pace with the S&P 500. It is below resistance at line i
- Weekly OBV has turned up over the past few weeks but is still below its weighted moving average and the downtrend, line j
- Resistance now stands at $30.60-$32
NEXT: 2 More Stocks That Are Vulnerable to Post-Earnings Selling
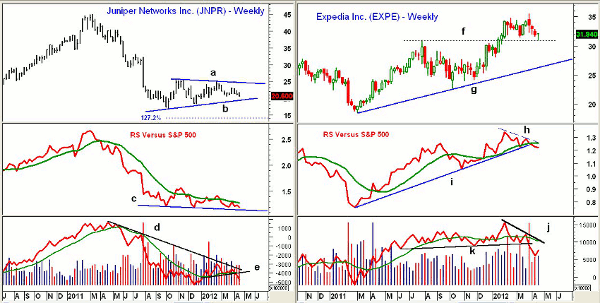
|pagebreak|The weekly chart of Juniper Networks Inc. (JNPR) shows a similar flag formation, lines a and b. Last week’s close was the lowest since March 20. JNPR reports earnings after the close on Tuesday.
- On a break of weekly support, line b, the 127.2% Fibonacci downside projection is in the $14 area
- Weekly RS line has formed lower lows, line c, and the RS is below its declining weighted moving average. This indicates that JNPR is underperforming the S&P 500
- Weekly OBV dropped below support, line e, two weeks ago, which confirmed the price action
- OBV has stayed below its long-term downtrend, line d
- There is first weekly resistance now in the $23 area
Expedia Inc. (EXPE) reversed four weeks ago after reaching a high of $35.57. It reached first weekly support in the $31 area, line f, last week. This also corresponds to the highs from the summer of 2011. The company will report earnings at 2:00 pm ET on Thursday, April 26.
- The RS line formed a negative divergence at the recent highs, line h, and has broken the uptrend going back to early 2011
- Weekly OBV also formed a negative divergence at the recent highs, line j, which was confirmed by the break of support at line k
- Weekly OBV turned up last week while the daily OBV (not shown) is back above its weighted moving average
- There is near-term resistance at $32.50-$33.70
What It Means: A close in the Spyder Trust (SPY) below the support at $136.58-$137.07 on Monday would increase the downward pressure on the overall market. This would make a positive response to good earnings much more unlikely.
Everyone is waiting for the earnings report from Apple (AAPL) on Tuesday, especially after the recent decline in the stock. Of the four stocks I have analyzed technically, United States Steel Corporation (X) and Juniper Networks Inc. (JNPR) look the most vulnerable, followed by Netflix Inc. (NFLX).
Though the weekly divergences in Expedia Inc. (EXPE) do make the stock vulnerable to more selling, the longer-term trend is still clearly positive. There is good monthly support for EXPE in the $28 area.
How to Profit: Be sure to have stops in place on existing positions, and if any current stock holdings have earnings due out this week, taking a defensive approach may not be a bad idea.


