Even if you miss a major bottom in a stock or market, spotting flag formations can help you buy in and still enjoy most of the uptrend.
One of my favorite chart patterns is the flag formation. These flags or triangles are most often a continuation pattern, which is an interruption in the dominant trend.
Often, one might miss a stock or ETF that is completing a major bottom or major top. If you understand and are able to identify continuation patterns, you will often be able to find a better risk/reward entry point and catch more of the major trend.
When the flag is formed as an interruption in a major uptrend, it is often referred to as a "bull flag." The formation of a flag formation during a downtrend is therefore known as a "bear flag." Let's look at some past and current examples.
Chart Analysis: In either a bull or bear market, whether you are talking about a stock, ETF, or commodity, it is common to see a series of flag formations.
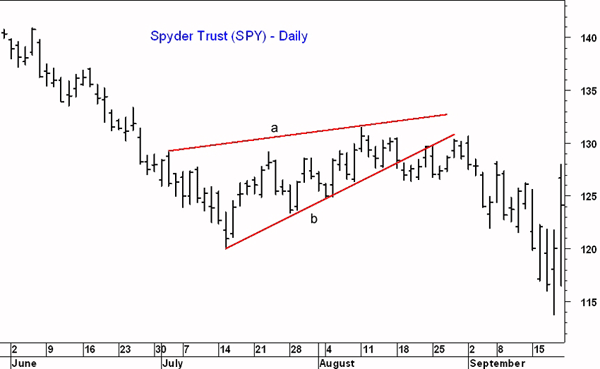
In the 2007-2009 bear market, there were quite a few "bear flags" evident on the daily chart of the Spyder Trust (SPY) between June and September 2008.
The bear market rally from the March 2008 lows terminated in May, as noted in a recent Week Ahead column.
- SPY had dropped from a high of $144.30 to a July low of $120.20 before it started a rebound
- After two to three weeks of upward action, an uptrend (line b) could be drawn
- After the high on August 11, the flag formation (lines a and b) took shape
- Five days later, SPY closed on support (line b) and then closed below it the following day. This completed the flag formation
- The SPY gave investors many attempts to establish a short position as it rebounded for the next eight days, closing one day above the former uptrend (line b)
- The rebound high at $130.71 was well below the August 11 high of $131.51
- The selling picked up after the Labor Day holiday, as SPY dropped 11.5% in the next thirteen days
NEXT: Gold and Currencies
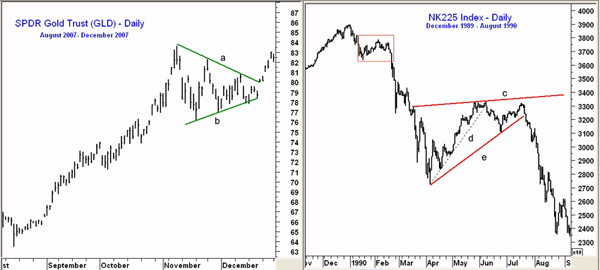
|pagebreak|During the incredible rally in gold futures and in the SPDR Gold Trust (GLD), there have been a number of flag formations. Some have lasted many months; others, only a few weeks. This daily chart covers the action in GLD from August through December 2007.
- GLD has just rallied from a low of $63.47 in August to a high of $83.64 in November, a 31.7% gain
- In just seven days, GLD dropped to a low of $76.11 (a 9% decline). This decline signaled that a correction was underway
- Most traders, after missing a sharp rally, are too eager to get back in and buy on the first bounce
- GLD managed to move back above the $82 level before the rally fizzled. This established the downtrend, line a
- On the next decline, GLD held above prior lows, which was a positive sign, and a level of support was established, line b
- The flag formation (line a and b) was not complete until prices reached the apex of the flag-but the rally was still quite dramatic. GLD gained another 20% in the next four months
One of the most historic bear markets developed after the December 1989 high of 38,957 for the Nikkei-225 Index. As I mentioned earlier, flag formations come in all sizes, and after declining for just ten days the Nikkei started to rebound.
- The rebound lasted about three weeks (see red box), and formed a very-short-term flag formation. On an hourly chart, this would be much more evident.
- The Nikkei dropped 10,000 points in the next 33 days, and finally stabilized in April with a low of 27,251.
- The Nikkei began a very sharp rebound, which after a few weeks allowed one to draw the uptrend, line d, which stayed intact until early June.
- Often times you will discover that one flag formation becomes part of a larger flag formation.
- From the May-June highs, you were able to identify a good level of resistance, line c. Thus you had a flag formation, lines c and d.
- The drop through support at line d completed the flag formation. After the initial decline, the Nikkei began to rebound again, and a new level of support (line e) was evident.
- This was part of a larger flag formation, lines c and e. The rally into July peaked at 33,177, which was just below the May high of 33,244
- The completion of the flag had even more negative implications, and the Nikkei lost 12,000 points by September.
How to Profit: By looking for the formation of flags in either up or down trending markets, I think you will be better able to identify good risk/reward entry points.
In this week's Trading Lesson, to be released Thursday afternoon, I'll continue this discussion of flag formations. I'll also show you how Fibonacci analysis can help you identify entries, exits, and protective stops when trading flag formations.
To sign up to receive this lesson (free, as always) by email, please click here.


