As the market continues to flirt with all-time highs and merger mania is in the air, MoneyShow's Tom Aspray takes a technical look at a sector highlighted by Warren Buffett's most recent purchase of the iconic ketchup company.
The rising M&A activity has certainly helped keep the market's tone positive. Tuesday's close was the strongest we have seen since early in the month when another short-term trading range was also completed. Market internals were better than 2-1 positive and the NYSE A/D line has made another new high.
The buyout of H.J. Heinz Company (HNZ) has turned the focus on the food stocks and has given quite a boost to the S&P Consumer Staples sector, which broke out of a 12-year trading range last year. The gains have been dramatic for what is generally considered to be a defensive sector.
The Sector Select SPDR Consumer Staples (XLP) is up 8.9% so far in 2013 versus just a 7.6% gain in the Spyder Trust (SPY). With one food stock already in the Charts in Play portfolio, what other food stocks should you be watching?
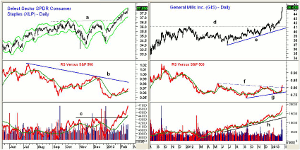
Chart Analysis: The Sector Select SPDR Consumer Staples (XLP) closed above the early October highs, line a, on January 25. This makes $36.70 the first level of strong support.
- Tuesday's close was quite near the daily starc+ band with the weekly starc+ band now at $38.41.
- The daily relative performance has been in a short-term uptrend since early in the month.
- The weekly RS line (not shown) is likely to move above its declining WMA this week.
- The daily OBV looks much stronger as it confirmed the price action by overcoming the resistance at line c.
- There is first support for XLP at $37-$37.40 with stronger in the $36.40 area.
General Mills Inc. (GIS) staged a marginal breakout in December as it overcame the resistance at $41.15, line d.
- After the breakout, GIS dropped back to the $40 level in the latter part of December and tested its uptrend, line e.
- The daily relative performance is just completing its bottom formation as it has moved through resistance at line e.
- The RS line has been in an uptrend since last September.
- The daily OBV broke through its resistance from 2011 in early 2012 and has been in a strong uptrend, line g, since last summer.
- The weekly OBV (not shown) is well above its rising WMA.
- There is minor support now at $44 with much stronger in the $43.40-$43.30 area.
NEXT PAGE: 2 Food Stocks to Watch
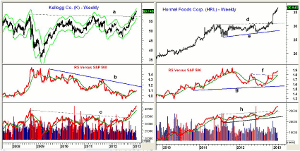
|pagebreak|Kellogg Co. (K) had been one of the lagging food stocks but it broke through resistance from 2009, line a, in January.
- This makes the first important support in the $56-$57.40 area.
- The weekly starc+ band is now at $61.18 and the long-term trading range has upside targets in the $67-$70 area.
- The weekly relative performance completed a bottom formation in late December but is still below its long-term downtrend, line b.
- The weekly on-balance volume (OBV) started accelerating to the upside last November after it overcame long-term resistance at line c.
- The OBV breakout led prices by almost two months.
Hormel Foods Corp. (HRL) developed a trading range from the middle of 2011 through the end of December 2012 (line d and e).
- The resistance at line d was slightly overcome in the middle of December and then HRL accelerated to the upside after it announced it was acquiring Skippy Peanut Butter.
- The stock has closed higher for the past seven weeks.
- The upside target from the trading range, lines d and e, has already been met.
- The weekly relative performance overcame its resistance, line f, in early January.
- The OBV has been rising more sharply than prices since the middle of last year, line i.
- The OBV broke through its resistance, line h, in the middle of January.
- There is initial support now at $34.40-$35.60.
What it Means: It is hard to know whether there will be further buyouts in the consumer staples sector but the recent long-term breakout in Kellogg Co. (K) is quite impressive.
A retest of the breakout level should be a good buying opportunity.
How to Profit: For Kellogg Co. (K), go 50% long at $57.76 and 50% long at $56.52, with a stop at $54.28 (risk of approx. 5%).
Portfolio Update: On December 17, I recommended going 50% long General Mills Inc. (GIS) at $40.61 and 50% long at $40.14. Use a stop now at $41.28.


