
With most people’s attention focused on the never-ending fiscal cliff debate in Washington or the Christmas holidays just around the corner, it’s easy to miss earnings announcements this week. MoneyShow’s Tom Aspray takes a technical look at the three most interesting stocks in this group.
The lower close Friday did not suggest very heavy selling and that makes the action early in the week quite important. A day of heavier selling would not be surprising, but it will take several days of stronger selling to suggest that this is more than a correction in an uptrend. There was good support for the Spyder Trust (SPY) at $140.40-$140.80.
Even though stocks have rallied from the mid-November lows, money continues to move out of equities. In the week ending December 5, another $7.16 billion came out of equity funds according to the Investment Company Institute. This was much worse than the $627 million the prior week, but was still below the $8.81 billion that came out the week after the election.
While the threat of the fiscal cliff continues to dampen stocks prices over the short-term, moving into 2013 I expect more positive developments. As I discussed in last Friday’s Week Ahead column Stuff Those Stockings with Stocks, the investing public is under invested in the stock market. Historically, the public has often jumped into the stock market when it was closer to a market high than a market low.
Therefore, further weakness is likely to be a good buying opportunity. For those who are not comfortable with individual stocks, I continue to like the two small- and micro-cap closed end funds I recommended last week.
Even though we are close to the end of the year, there are several earnings reports this week that will be watched closely. Often times by using weekly relative performance, volume, and Fibonacci analysis you can get advance warning of post-earnings shocks. These three stocks look the most interesting this week.
Click
to Enlarge
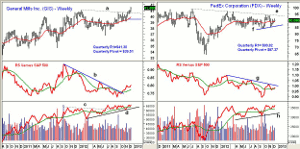
Chart Analysis: General Mills Inc. (GIS) reports its earnings on Wednesday and most analysts are looking for an increase in quarterly revenues. The weekly chart shows that year-long resistance, line a, was overcome three weeks ago.
- The strong close last week was above the quarterly R1 resistance at $41.30.
- There is weekly trend line resistance and quarterly R2 resistance at $42.55.
- The relative performance broke its weekly downtrend, line b, in mid-October. The bottom was confirmed a few weeks later in November as it was in a clear uptrend.
- The weekly on-balance volume (OBV) turned up from its WMA last week with support at line d.
- The OBV had broken through its long-term resistance, line c, last summer.
- There is initial support now at $40.40-$40.80, with the rising 20-week EMA at $39.94, the quarterly pivot is at $39.51.
Federal Express (FDX) also reports earnings on Wednesday morning. In September, FDX lowered their outlook for 2013, which pushed the stock to a low of $83.91. Profit is expected to decline as many are looking for up to a 10% drop in quarterly earnings when compared to last year.
- The quarterly R1 resistance is at $90.55 and the downtrend from early 2011, line e, is now at $94.20.
- The high from early in the year is at $97.19.
- The relative performance or RS line is barely above its WMA and still below the resistance at line g.
- The weekly OBV looks much stronger as it made new rally highs in October and is holding well above its WMA.
- There is initial support at $88.80 and then at $87.23, which is the quarterly pivot.
NEXT PAGE: Which Stock Looks Most Interesting?
|pagebreak|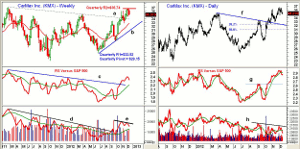
Click
to Enlarge
CarMax Inc. (KMX) reports its earnings before the opening on Thursday. Earnings per share are expected to be down slightly as quarterly EPS missed by 7% in September.
- For the past three weeks KMX has bumped into the resistance at $36.65, which is just below the quarterly R2 resistance at $36.74.
- The weekly chart shows that the long-term downtrend, line a, was overcome in early November. It is now at $34.
- The rising 20-week WMA is at $32.74, with the quarterly R1 at $32.52.
- The relative performance confirmed the price action breaking its downtrend, line c. It has turned down, but is well above its WMA.
- The weekly OBV broke its downtrend, line d, in September. The OBV now shows a short-term negative divergence, line e.
The daily chart shows the correction for most of last week with next support at $34.58. The former downtrend (now support) at line f, is now at $32.50.
- The 38.2% Fibonacci retracement support is at $32.13, with the 50% support at $30.74.
- The daily relative performance has turned lower, and it has good support at line g.
- The daily OBV has been weaker than prices for the past three months, line h, and has now dropped below its WMA.
- From both the daily and weekly charts, there is strong support in the $32.13 to $32.74 area, with the quarterly R1 in between.
What It Means: Of the three stocks, General Mills Inc. (GIS) looks the most interesting on a pullback as it is well above the current quarterly pivot at $39.51. Based on data through last Friday, the pivot for next quarter is at $40.72. This will be level to watch as we head into 2013.
Federal Express (FDX) may have prepared the market for an earnings miss and could rally on weak earnings. Stops need to be under the November low, and I have no recommendation for now.
CarMax Inc. (KMX) looks the most vulnerable over near term as the weekly and daily OBV divergences are consistent with a correction that would last several weeks. I would look for signs of stabilization at stronger support before taking a position.
How to Profit: For General Mills Inc. (GIS), go 50% long at $40.61 and 50% long at $40.14, with a stop at $38.97 (risk of approx. 3.4%).


