Despite the fact that they are currently overbought, once these market-leading stocks start to correct, they should prove to be attractive new buys, writes MoneyShow’s Tom Aspray.
Overseas markets opened the new week under pressure as Japan’s Nikkei 225 lost around 2% on the back of a stronger yen. Even the better-than-expected manufacturing data out of the Eurozone did not support the markets as their bank stocks were under pressure.
The stock index futures did close last Friday above the day’s lows. This was an encouraging sign but it will take a move above last week’s highs to trigger a stronger rally that could squeeze those on the short side.
The Dow Industrials led the market on the downside in January as it lost 5.3% in January versus a 3.6% decline in the S&P 500 while the Nasdaq lost just 1.7%. Followers of the January barometer will therefore be looking for the stock market to closer lower in 2014. As I pointed out in Friday’s Week Ahead column, the NYSE A/D line suggests that it might be wrong this year.
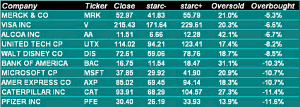
This month’s scan of the stocks in the Dow Industrials reveals that some of the Dow stocks did significantly better than either the Industrials or the S&P 500. The most overbought Dow stock, based on the starc band analysis, was Merck & Company (MRK). It closed just 5.3% below its monthly starc+ band and was up an impressive 5.8% for the month.
In a down market, those stocks that are able to stay the closest to their monthly starc+ bands often have the strongest relative performance analysis. Therefore, once the market correction runs its course these stocks often continue to outperform the market averages. A look at the monthly charts of these most overbought stocks highlights three that could be star performers in 2014.
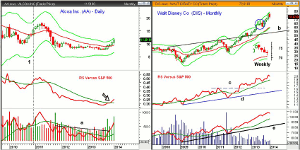
Chart Analysis: Alcoa Inc. (AA) is the third most overbought Dow stocks, and for the first time since 2011, the monthly analysis does suggest that it has made a major turn.
- The monthly starc+ band is at $12.28 with the quarterly projected pivot resistance at $12.70.
- The weekly chart shows that a doji formed last week.
- A weekly close below $11.17 would trigger an LCD sell signal and a good buying opportunity.
- The relative performance moved above its WMA at the end of December for the first time since 2010.
- In 2010, AA continued higher for another four months before turning negative in July 2011.
- The volume was heavy last month and the OBV looks strong as it has moved well above the resistance at line a.
- The OBV moved above its WMA at the end of October.
- The weekly technical studies did confirm the recent highs as AA traded well above its weekly starc+ bands over the past two weeks.
- The daily studies are looking toppy with the monthly pivot at $11.22.
- There is more important support in the $10.90 to $10.54 area.
Walt Disney Co. (DIS) was high on the most overbought list of last May as it surged well above its monthly starc+ band. This resulted in a four-month trading range (see circle) before the uptrend resumed.
- DIS peaked early in January at $76.84 and hit a low last week of $71.12, which was a drop of 7.4%. It did close above the quarterly pivot at $72.01.
- The quarterly projected pivot support is at $67.49.
- The insert of the weekly chart shows that DIS has closed lower for the past four weeks and is now close to its 20-week EMA at $70.60.
- A doji was formed last week and a close this Friday above $73.63 will trigger a high close doji buy signal.
- The relative performance broke out to the upside in 2012 as it overcame the resistance at line c.
- The RS line did confirm the recent highs as did the weekly RS line.
- The OBV moved above its WMA at the end of January 2012 and continues to look very strong.
- The OBV is well above its rising WMA and major support at line e.
- The weekly OBV (not shown) dropped below its WMA two weeks ago, and I will be watching for a higher weekly close to see if it triggers an AOT buy signal.
NEXT PAGE: 2 More Overbought Dow Stocks to Watch
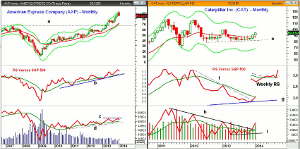
|pagebreak|American Express (AXP) is near the bottom of the most-overbought list as it peaked at $93.62 just ten days ago and is now 9.2% below this high. It did close the month lower.
- The quarterly pivot is at $84.55 with the 50% Fibonacci retracement support from the August 2013 low at $82.31.
- This is just above the monthly projected pivot support at $82.08.
- The 61.6% retracement support stands at $79.66.
- The relative performance did confirm the recent high but has turned lower.
- The weekly RS line (not shown) is still above its WMA.
- The monthly OBV did not make a new high in December so a negative divergence has formed.
- A drop in the OBV below the August lows will confirm the divergence.
- The weekly OBV (not shown) did confirm the recent highs.
- There is resistance now in the $88.25 to $89.31 area.
Caterpillar Inc. (CAT) has performed poorly over the past two years as it was up 2.2% in 2012 and just 3.2% in 2013.
- The monthly chart shows a very tight range since July 2012 with support in the $81 area.
- There is next resistance from early 2013 at $99.70 with the monthly starc+ band at $104.60.
- The quarterly pivot is at $88.12 with the January low at $85.88.
- The two-year downtrend in the relative performance, line f, was broken in December.
- The RS line is still below its WMA but the weekly RS (see insert) shows a completed bottom formation.
- The monthly has overcome its major downtrend, line h, from early 2011.
- The OBV traded in a tight range in 2013 before its upside breakout.
- The volume was high last week and the weekly OBV also looks strong.
What It Means: Of the three stocks, Walt Disney Co. (DIS) looks the most attractive followed by Caterpillar Inc. (CAT). I have been negative on Alcoa Inc. (AA) for several years but it looks more positive for 2013.
The mixed technical signals are keeping me on the sidelines when it comes to American Express (AXP) though I will be watching the Fibonacci retracement levels closely.
How to Profit: For Alcoa Inc. (AA), go 50% long at $10.86 and 50% at $10.24, with a stop at $9.88 (risk of approx. 6.3%.
For Walt Disney Co. (DIS), go 50% long at $71.44 and 50% at $70.24, with a stop at $68.23 (risk of approx. 3.7%).
For Caterpillar Inc. (CAT), go 50% long at $89.14 and 50% at $86.82, with a stop at $85.17 (risk of approx. 3.2%).


