Given that many of the energy stocks and energy ETFs have been correcting from their recent highs, MoneyShow’s Tom Aspray uses technical analysis to determine if they appear to be holding support and whether or not now is the time to buy.
The stock market held up well on Monday as the heavier early selling was well absorbed as the averages closed with just minor losses. Positive earnings after the close from Netflix, Inc. (NFLX) and Chipolte Mexican Grill (CMG) are likely helping the futures trade higher early Tuesday. The European markets are also showing nice gains. They have recovered most of Monday’s losses.
The McClellan oscillator turned lower to -119 Monday after reaching a low of -196 last Thursday. It does not yet show a completed bottom formation but could on one more drop. The NYSE A/D line is still below its flat WMA, consistent with either a trading range or the formation of a top.
Last week’s sharp rebound in crude prices was impressive and the rally continued on Monday. This suggests that major resistance may be tested on this rally. Many of the energy stocks and the energy ETFs have been correcting from their recent highs. They do appear to be holding support, but does that mean you should be looking to buy?
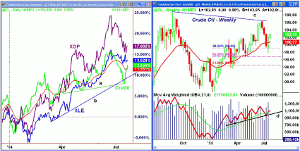
Chart Analysis: The 2014 % Change chart shows that, despite its recent sharp decline, the SPDR S&P Oil & Gas Exploration & Production (XOP) is still leading the Select Sector SPDR Energy ETF (XLE) and crude oil so far in 2014.
- XOP was up over 24% on June 20 after being down almost 5% in early February.
- After the recent correction it is up just over 17%.
- In contrast, XLE was down over 6% in February but has only corrected slightly from its recent highs.
- Crude oil prices diverged from the energy sector in February as they were up almost 11% in early March prior to a two week correction.
- The chart shows the recent sharp pullback in crude as it went from up over 16% to up just 7% in the middle of July.
- Over the past week, crude oil prices have gained over 5% from the lows, but can the rally in crude continue?
The weekly chart of the crude oil futures shows that prices dropped to the 38.2% to 50% Fibonacci retracement zone last week.
- The spike low last week dropped prices briefly below the quarterly pivot at $98.53.
- There is more important chart support from the May lows at $96.70 with the quarterly pivot support at $95.05.
- On the correction, the weekly OBV dropped below its WMA but held the uptrend, line d.
- The OBV did confirm the late June highs and does show a pattern of slightly higher highs.
- The daily OBV (not shown) is back above its WMA but is well below its recent highs.
- The three week highs have been exceeded this week.
- There is next strong resistance in the $103.85-$104.20 area.
- There is major weekly resistance, line c, in the $106-$106.50 area.
NEXT PAGE: Two More Charts to Watch
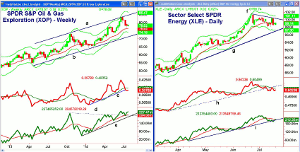
|pagebreak|The weekly chart of SPDR S&P Oil & Gas Exploration & Production (XOP) shows a well defined trading channel, lines a and b.
- The upper boundary and weekly starc+ band were tested in late June.
- The 2nd quarter’s projected pivot at $78.18 was easily exceeded as XOP had a high of $84.04.
- The monthly projected pivot support at $77.23 has been tested over the past five days.
- The 38.2% Fibonacci retracement support is at $76.18 with the 20-week EMA at $76.54.
- The weekly relative performance shows a pattern of higher highs since the early 2014 lows.
- The uptrend in the RS (line c) was slightly broken last week.
- The weekly OBV has turned up from its WMA after breaking through resistance at line d, last month.
- At the May 16 lows, the OBV dropped below its WMA before triggering an AOT buy signal.
- Volume increased Monday but the daily OBV is still just below its WMA.
- The quarterly pivot is at $78.07 with last week’s high at $79.88.
- The last swing high from early July was at $82.69.
The Select Sector SPDR Energy ETF (XLE) has been in a narrow range since June 23 when it formed a doji high of $101.52.
- XLE has been trading above and below its 20-day EMA.
- It has been holding well above the uptrend (line g) at $96.96.
- The quarterly pivot is at $96.48 with monthly projected pivot support at $95.88.
- The short-term downtrend, line f, is now in the $100.55 area and a close above this level would be an upside breakout.
- The daily starc- band is at $101.11 with the weekly at $103.84.
- The monthly projected pivot resistance is at $105.74.
- The daily RS line dropped below its uptrend, line h, last week and is still slightly below its WMA.
- The weekly relative performance (not shown) is turning up from its WMA.
- The daily OBV has tested its uptrend and is just slightly below its WMA.
What it Means: Monday’s positive earnings set a bullish tone for the week. Therefore, an upside breakout from the recent trading range cannot be ruled out. The S&P futures are close to breaking out early this morning as a close above 1979 in the futures should signal a move to the 2000 area. Still, those stocks with negative weekly charts are unlikely to participate.
This could be accompanied by further negative divergences in the NYSE Advance/Decline which is still well below the early July highs.
On rally from current levels, the charts of both the XOP and XLE suggest they could move back to or above their recent highs. Energy stocks are one of the stronger market sectors and would continue to avoid the weakest groups (Time to Buy the Year's Worst?)
How to Profit: No new recommendation but may recommend a short-term trade via Twitter if the daily technical studies turn positive.


