So far, it's not only been a tough earnings season because of stocks that missed estimates but also because of stocks that were positive but not as good as expected, so MoneyShow's Tom Aspray takes a technical look at the charts to review last month's portfolio hits and misses.
The impressive rebound in both the Euro zone and US markets have caused further improvement in the market's outlook as the A/D ratios were better than 3-1 positive. The volume analysis has continued to lag but nevertheless it appears that the worst of the selling is over.
While there has been a slight pickup in overall market volatility, it has been a tough earnings season for those stocks that disappointed investors with their earnings. It was not only those stocks that missed earnings estimates but also those that were positive but not as good as some expected.
In the most recent trading lesson Three Reasons To Sell, I took a look at some of the technical signs that I look at as a stock is about to report earnings. They can help me decide to reduce the size of my position in any one stock or raise the protective stops. In some instances, there were not clear warning signs and quite a few stocks were stopped out at levels that were lower than I would have liked.
The sharp decline in the Euro zone markets took out the portfolio position in one of the portfolio's core ETF holdings, the Vanguard FTSE Europe (VGK). Those that began a dollar cost averaging program in this and two other large ETFs, as I recommended at the end of May, should stick with their long positions.
Let's take a look at some of the portfolio hits and misses over the last month.
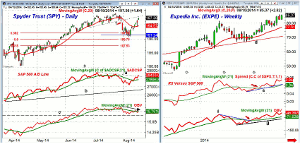
Chart Analysis: The Spyder Trust (SPY) closed back above the $197 level as the former uptrend has been reached.
- The SPY had gapped through this support on July 31 (point 1) as several different levels of support were quickly violated.
- The SPY eventually tested the 38.2%-50% support zone.
- The monthly projected pivot support at $191.02 was violated with a low of $190.55.
- The negative divergence in the S&P 500 A/D line (line a) had warned of the correction in advance.
- The A/D line has now moved back above this resistance, which is a sign that the correction is already over.
- I would look for the A/D line to test its WMA on a pullback.
- The OBV is still acting weak as it still slightly below its WMA.
- The OBV is still holding above more important support.
- Next resistance at $198.59 and the daily starc+ band with the all time high at $RE199.06.
- The monthly projected pivot resistance is at $201.13.
Expedia, Inc. (EXPE) was recommended in late May and the strategy was reviewed in my trading lesson Advanced Entry Techniques for Any Market.
- The monthly projected pivot resistance at $84.68 has been overcome.
- The quarterly pivot resistance is at $89.05 with the weekly starc+ band at $91.05.
- The weekly chart shows a steady rise form the May lows.
- The daily relative performance bottomed out in May and the weekly moved through resistance in the middle of June (see arrow).
- The RS line is still acting well and is well above its WMA.
- The weekly OBV moved through its downtrend, line f, at the end of May.
- It still looks positive as it is well above support at its uptrend (line g) and WMA.
- The daily studies (not shown) have confirmed Monday's new high.
- There is initial support now in the $82.50 and $83.12 area, which corresponds to the 20-day EMA.
NEXT PAGE: Another Stock and Another ETF to Watch
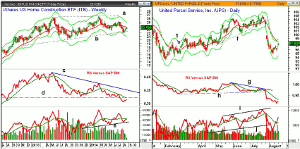
|pagebreak|The strong close in the iShares Dow Jones Home Construction ETF (ITB) above $25 in early July was confirmed by the daily OBV. Monday's Housing Market Index was a positive for this industry group.
- The ITB reversed the following week and dropped back to its weekly starc- band.
- The ITB close at $23.83 on Friday, July 11 was below the quarterly pivot at $24.22.
- It had a correction low of $21.96 on August 1.
- ITB has rebounded from the lows over the past few weeks and is now testing its 20-week EMA.
- The daily RS line appeared to complete its bottom in early July but the weekly did not.
- The weekly RS line just tested its WMA before dropping through support on July 11.
- The weekly and daily OBV were both positive in June but subsequently reversed to the downside.
- The weekly OBV has now moved back to its WMA while the daily is slightly positive.
- The quarterly pivot is now at $24.20 with further resistance at $24.50.
United Parcel Service, Inc. (UPS) was recommended in early March (point 1) and dropped to a low of $94.17 in early April before it turned higher.
- The positive weekly signals were confirmed by early May as it rallied to a high of $103.43.
- The support at $100 held on the pullback and UPS made a new high of $104.36 on July 16.
- UPS plunged in reaction to its earnings as it opened at $99.58 on July 29 well below the stop at $101.36.
- UPS has had a low this month of $94.21.
- The daily RS line did form a lower high in July, line g.
- The support at line h was not broken until UPS gapped to the downside.
- The daily OBV did confirm the price highs and dropped below its WMA on July 29.
- UPS
has rallied back to its declining 20-day WMA but the weekly studies are now
negative.
What it Means: The quickness of the decline in the Spyder Trust (SPY) caught me by surprise as my order to sell half at $199.17 was just missed as the high was $199.06. I thought I would get a further chance to take partial profits as clearly a 4.8% profit was not enough.
I am watching Expedia, Inc. (EXPE) closely and hope to take some profits on a move to the quarterly pivot resistance.
The biggest drain on the portfolio since the middle of July has been in the homebuilding sector as these stocks really disappointed the market with their earnings. This has been a good industry group for me in the past but took too large a position.
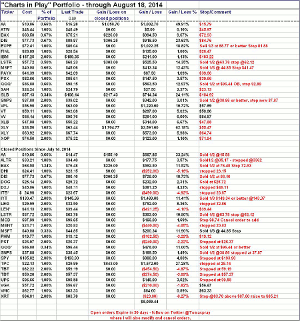
Though the closed positions resulted in just over a $6000 profit I am not happy
with the results.
The good news is there is plenty of cash to invest as we enter the more stock-friendly
fall months. Before I become a more aggressive buyer I want to see confirmation
of a new uptrend in the A/D lines and improvement in the OBV.
How to Profit: No new recommendation.
Portfolio Update: For the Spyder Trust (SPY),
longs established at $185.02, stopped out at $193.90.
For Expedia, Inc. (EXPE)
long from $72.41 raise the stop now to $81.88.
Sell 1/3 at 88.77 or better.
Long positions in the iShares Dow Jones Home Construction ETF (ITB) from $24.90 stopped out at $23.67.
Longs in United Parcel Service, Inc. (UPS) from $96.66 stopped out at $99.58.
NEXT PAGE: The Charts in Play Portfolio
|pagebreak|


