Many are wondering whether the utility sector will continue to lead the market for the rest of the year, so MoneyShow's Tom Aspray takes a technical look at two utility ETFs and a strong utility stock along with a speculative one to determine if now is the time to buy the utilities.
Wednesday's release of the FOMC minutes revived the debate over when the Fed might raise rates and has added further focus on Friday's Jackson Hole meetings. The Nasdaq 100, which has been leading the market, was flat for the day while the small-cap Russell 2000 was down 0.43%.
The market internals were neutral, which has caused the McClellan oscillator to turn lower, which may be signaling the start of an overdue pullback. The economic slate is heavy today with more data on manufacturing as well as the Existing Home Sales and the Leading Indicators.
Overseas, the economic data was not encouraging as the Euro zone's purchasing managers index from Markit declined, consistent with the economic slowdown. In addition, China's factory activity dropped to the lowest level in the past three months.
Many are wondering whether the utility sector will continue to lead the market
for the rest of 2014. The Sector Select SPDR Utilities (XLU)
is up 13.7% YTD but is still 4.4% below its 52-week high. With significantly
higher yields than the 10 Year T-Note, is now the time to buy the utilities?
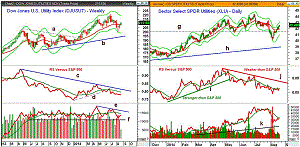
Chart Analysis: The Dow Jones US Utility Index (DJUSUT), which is made up of 62 utility companies, peaked at 220.59 in July.
- The weekly starc- band was tested three weeks ago.
- The Index is still 4.5% below its high as it is trying to close the week back above its 20-week EMA.
- There is next resistance in the 213.50-215 area with the weekly starc+ band at 219.12.
- The weekly relative performance dropped below its WMA in late May and then dropped below support (line d) in late June.
- The RS line is still well below its long-term downtrend, line c, despite the recent rally.
- The weekly on-balance volume (OBV) formed a negative divergence at the recent highs, line e, as it did not make a new high with prices.
- The OBV has bounced from support (line f) but is still below its WMA.
The Sector Select SPDR Utilities (XLU) is more narrowly based with just 30 holdings and a current yield of 3.57%. It is more liquid than the iShares US Utilities (IDU) which tracks the DJUSUT.
- XLU dropped below support, line g, at the end of July.
- The recent rally has now taken XLU above this resistance at $41.50.
- The quarterly pivot and further resistance is now at $43.07, which also corresponds to the daily starc+ band.
- The relative performance was in a solid uptrend from the December lows, indicating it was outperforming the S&P 500 (SPX).
- The uptrend was broken in early May, which was six weeks before XLU peaked out.
- The RS line is now in a solid downtrend, line j, despite the recent rally.
- The daily OBV did confirm the price action but then dropped below support at the end of July.
- The daily OBV has long-term support at line k.
- The weekly and monthly OBV are both positive, confirming the price action.
- There is minor support now in the $41.20-$41.60 area.
NEXT PAGE: Two More Utility Stocks to Watch |pagebreak| Duke Energy (DUK) is the largest holding of XLU as it makes up just over 9% of the ETF. It has a current yield of 4.31% and is just 3.15% below its 52-week high.
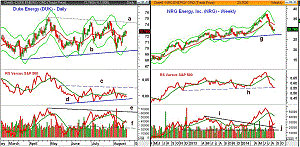
- The daily chart shows a broad trading range, lines a and b, as it had a low of $68.71.
- This was just slightly above the June low at $68.04, which represents more important support.
- The daily starc+ band and major resistance (line a) are now in the $74-$74.50 area.
- The relative performance has been in a trading range since May, lines c and d.
- A move above the resistance, at line c, is needed to signal that DUK is becoming a market leader.
- The weekly RS line (not shown) is below its WMA.
- The daily OBV reached the April high, line e, in July before reversing.
- The OBV support, at line f, was tested but the OBV has now dropped below its WMA.
- The weekly OBV (not shown) is above its WMA but below the previous high.
- There is initial support now in the $70.42-$71 area.
NRG Energy, Inc. (NRG)
is a diversified utility that owns and operates power generation facilities.
It has a current yield of 1.75%.
- It is down 21.9% from its 52-week high of $38.09 as its operating expenses jumped 37% from the previous year.
- The weekly chart shows that it has dropped all the way back to major support, line g, in the $27.25 area.
- NRG has been hugging its weekly starc- band for the past several weeks.
- The relative performance did confirm the new highs but is now back to major support at line h.
- The RS line is well below its WMA, which is declining.
- The weekly OBV is back to its breakout level at line i, and is trying to turn up.
- It has even stronger support at line j.
- The stock has bounced in reaction to its recent solar acquisition but the daily studies are still negative.
- There is daily chart resistance now in the $30.50-$31.40 area with the quarterly pivot at $32.82.
What it Means: There are no clear signs that the utility sector has completed its corrections as the sector, as well as many of the strongest stocks like Duke Energy (DUK), have just rallied back to resistance. The monthly analysis is positive but would wait to buy the strong utilities like DUK if we get a drop back to stronger support.
The more speculative utilities like NRG Energy, Inc. (NRG) have been hit hard by their earnings reports and it is a good example of why one needs to do thorough research before buying.
How to Profit: No new recommendation.


