The latest short interest data—which MoneyShow's Tom Aspray found quite interesting—was released on Tuesday, so Tom studies the charts of the four stocks that stood out to help traders decide whether the short positions will be rewarded by lower prices.
Stocks continued to edge higher Wednesday as pre-holiday volume remains low. The volume in the S&P futures was the lowest since just before the Memorial Day holiday. The futures are lower in early trading and are close to breaking below the lows of the past three days.
The analysis of the most recent Commitments of Traders (COT) data from John Person reveals that the small speculators are heavily on the long side of the futures. They historically are wrong on the markets so this is used as a contrary indicator.
The individual investors, according to the AAII, became even more bullish last week as 51.92% are now bullish, up from 46.11% last week. This is well above the long-term average of 39%.
The McClellan oscillator-which warned of the top in early August (The "Real Reason" for the Market's Plunge)-has formed a short-term negative divergence. This formation is consistent with a tired market while the positive intermediate-term signals suggest a correction will be a buying opportunity.
The latest short interest data was released on Tuesday and-as always-it's quite interesting. I have found that the Wall Street Journal presents the data in one of the most easy to use formats.
I look at not only the changes in short interest but also the days to cover or the short interest ratio. It is calculated by dividing the short interest by the average daily volume. In the latest data, four stocks stood out and looking at the charts can help one decide whether the short positions will be rewarded by lower prices.
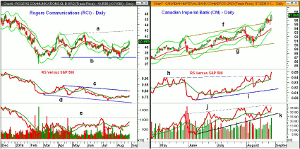
Chart Analysis: Rogers Communications (RCI) is a $21.08 billion Canadian wireless company that closed up 1.76% on Wednesday. The current yield for RCI is 4.3% but the lower current ratio of 0.45 suggests this large dividend may not be too safe.
- The short interest declined 1.9% as of August 15 but is still 9.97 million shares.
- Given the daily volume of 231K, it would take 43 days to cover the short position.
- RCI dropped down to test the support in the $38 area (line b) before starting an impressive rally.
- The 7.2% gain from the lows has taken RCI back to the daily starc+ band.
- The next resistance is at the May high of $41.99 and RCI looks ready to close the week back above the quarterly pivot at $40.50.
- The relative performance is still in a downward sloping channel, lines a and b, but is now back above its WMA.
- The daily OBV has been above its WMA since August 8.
- The OBV has key resistance at line e while the weekly OBV is close to moving above its WMA.
- The rising 20-day EMA and first support are now in the $39.77 area.
Canadian Imperial Bank (CM) has a market capitalization of $38.56 billion with a yield of 4%. It just reported earnings this morning. Unlike RCI, CM has a very large amount of cash on its books and is up 15.75% YTD. It has a short interest ratio of 41.
- The strong close Wednesday has taken CM well above the quarterly projected pivot resistance at $95.82.
- The daily starc+ band is at $98.03 while the weekly is not far above current levels at $97.86.
- The stock has made a new all time highs this week, so one wonders what kind of stop the short sellers are using.
- The daily chart shows the breakout above resistance at $95, line f, last week.
- The daily relative performance has confirmed the price action by also moving through important resistance at line h.
- The RS line has been in a solid uptrend, line i, since June.
- The weekly RS analysis (not shown) has bottomed signaling that CM is clearly a market leader.
- The daily OBV shows a pattern of higher lows (line k) and higher highs, line j.
- The weekly OBV (not shown) will make a new all time high this week.
NEXT PAGE: Two More Stocks with Short Positions to Watch
|pagebreak|PHH Corporation (PHH) is a $1.37 billion provider of outsourced mortgage and fleet management services. It has no yield with a short interest ratio of 33 as the number of shares short increased by 41.9% since the end of June.
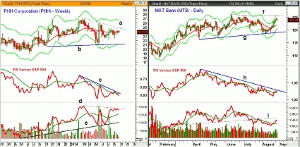
- The weekly chart shows that PHH peaked in early March at $27.13.
- PHH is just over 12% below its 52 week high.
- It has since formed lower highs, line a, and has traded in a tight range for the past three weeks.
- It may form another weekly doji this week with the quarterly pivot at $23.33.
- There is longer-term support in the $21.20 area (line b) and the weekly starc- band.
- The weekly RS line has formed lower highs in 2014, line c, and is below its WMA.
- The weekly on-balance volume (OBV) has been acting stronger than prices as it is well above its rising WMA.
- The OBV has stronger support at the uptrend, line e.
- The daily technical studies (not shown) do look weaker.
M&T Bank Corporation (MTB) has a yield of 2.26% with a short interest ratio of 29. The stock is up 7.52% YTD and is very close to strong resistance, line f, in the $125.80 area.
- The daily chart shows that MTB has been in a broad trading range, lines f and g, for the past six months.
- The weekly starc+ band is at $128.26 with the quarterly projected pivot resistance at $132.26.
- Though MTB is up 4.4% from the August low, line g, the relative performance is still in a downtrend, line h.
- The RS line made a new low last week and is still in a clear downtrend.
- The daily OBV has also had a weak rally as it dropped to new lows on August 15.
- The OBV had dropped through the support from early March, line i, in early July.
- This now becomes strong resistance and the weekly OBV is still above its WMA.
- There is short-term support now at $121.80 and the rising 20-day EMA.
What it Means: The short interest of a stock can often provide additional information when you are deciding whether to buy or sell a stock. Sometimes no information is provided. For example, Bitauto Holdings Ltd. (BITA) has a current ratio of 1.0 while it is just 1.11 for Facebook, Inc. (FB).
Trinity Industries, Inc. (TRN) was the only one of the four stocks discussed in Are IBD's Top Four Looking Toppy? that has a double-digit short interest ratio of 10.93.
It is important no matter whether you are trading a stock from the long or short side that you have a stop. Shorting a stock at all time highs, even if you are using options, can quickly destroy your portfolio.
Of the four stocks, PHH Corporation (PHH) appears to be the most vulnerable while Canadian Imperial Bank (CM) looks the strongest.
How to Profit: No new recommendation.
To learn more about the markets, you might enjoy Tom's Latest Trading Lessons.


