With just over a week before earnings season, there were stocks that won and lost based on new fundamental data last week, so MoneyShow’s Tom Aspray analyzes the charts to see if these ‘pops and drops’ changed their long-term technical outlook.
The volatility returned to the stock market last week with a vengeance as—while the market bears were pleased with the losses—the sharp rallies last Wednesday and Friday likely made them a bit nervous.
The demonstrations in Hong Kong Monday have started the week off on a negative note with the Hang Seng losing 1.9%. So far, the losses in Europe are small with the US futures trading sharply lower but still above key support at last week’s lows.
The selling was quite heavy last Thursday as the ARMS Index spiked to 2.16 but reversed back to the downside on Friday. Other technical measures are also getting oversold as the 5-day MA of the % of S&P 500 has dropped to 45%. It dropped to below 35% at the February and August lows.
Once again, the small-caps dropped the most last week with the S&P 600 losing 2.23% compared to the 1.37% decline in the S&P 500 and 0.96% drop in the Dow Industrials. The weakness in the small-cap stocks contrasts with the strong economic data, like the 4.6% final 2nd quarter GDP.
With just over a week before earnings season, there were stocks that won and lost last week based on new fundamental data. But did these ‘pops and drops’ change their long-term technical outlook? Let’s look at their charts.
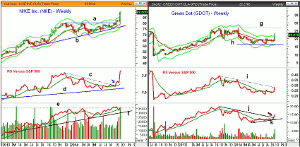
Chart Analysis: Nike, Inc. (NKE) was the week’s big winner as it gained 12.2% on Friday in reaction to a 23% jump in 1st quarter earnings, which widely exceeded analyst’s estimates.
- NKE is now up 14.76% YTD and 16.76% in just the past three months.
- The close was well above the weekly starc- band.
- The completion of the triangle formation, lines a and b, has upside targets in the $94-96 area.
- Based on current data, the 4th quarter projected monthly resistance is at $99.37.
- The weekly relative performance broke its downtrend, line c, at the end of August.
- The RS line was acting strong for two weeks prior to last Friday’s surge.
- Though the volume was heavy last week, it was not that much higher than last September’s volume.
- The weekly OBV just moved back above its WMA last week, signaling an AOT buy signal.
- The large gap makes identifying support difficult with the tentative quarterly pivot at $85.05.
- Prior to Friday’s surge, the month’s high was $82.79.
Green Dot (GDOT) was up 15.5% last week on news last Thursday that it has joined with Wal-Mart Stores, Inc. (WMT) to offer mobile checking accounts through GoBank.
- GDOT also closed the week above its starc+ band but is still down 11.45% YTD.
- The stock has been quite volatile over the past few years as it was down 60.9% in 2012 but gained 106% in 2013.
- GDOT is still below its January 2014 high at $26.87 and it had a high of $65.10 at the end of 2010.
- Based on current data, the monthly projected pivot resistance is at $26.96.
- With last week’s action, the relative performance has just broken its downtrend, line i.
- The RS line moved above its WMA on Friday, September 19.
- The weekly on-balance volume (OBV) also broke its downtrend, line j, a week ago.
- Volume has increased over the past two weeks with OBV support at line k.
- The projected monthly pivot for October is at $21.17 with the rising 20-day EMA at $19.74.
Next Page: Two of Last Week’s Drops
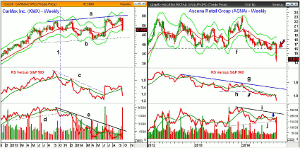
|pagebreak|CarMax, Inc. (KMX) dropped 9% last Tuesday after announcing a slowdown in same store sales. Concerns over tight sub-prime financing suggested continued slow growth.
- Just three weeks ago, KMX had traded over $54 per share as it came close to long-term resistance at line a.
- The recent rally just barely exceeded the June highs.
- Last Friday’s close was below the quarterly pivot of $49.41 and the weekly starc- band.
- For the 3rd quarter, the projected support is at $44.94.
- The long-term chart support, line b, is a bit lower at $43.29.
- In October 2013 (line 1), the RS line dropped below its WMA and support.
- The downtrend in the RS, line c, was broken in June but it failed well below the previous highs.
- The weekly OBV also peaked last October as it dropped below support at line d.
- Both the RS and OBV were much weaker than prices at December highs.
- The OBV has stayed below its bearish divergence resistance since December 2013.
- There is initial resistance at $48.50-$49 with the declining 20-day EMA at $50.92.
Ascena Retail Group (ASNA) is a $2.19 billion specialty woman’s retail apparel company. It was up 1.7% on Friday, but still was down 19.6% for the week after reporting very weak 4th quarter earnings and a disappointing 2015 outlook.
- ASNA is down 35.7% YTD and has gained only 0.37% over the past three years according to Morningstar.com.
- ASNA spiked to a high of $23.14 early in the year as the weekly starc+ band was tested.
- The close last week was below the thirty month support at line e, in the $16 area.
- The relative performance has been in a well established downtrend, line f, since the middle of 2012.
- The RS line broke further support, line g, early in the year and plunged last week.
- The weekly OBV formed a negative divergence in early 2014, line h.
- The OBV dropped below its support, line i, the week before last week’s plunge.
- The projected quarterly pivot is at $14.83 with the 20-day EMA at $15.84
What it Means: As I noted in Friday’s Week Ahead column, despite the market’s recent decline, the outlook for the economy or future growth has not changed.
These four stock examples illustrate the sharp contrast between those stocks that are outperforming the S&P 500 and those that are underperforming. The relative performance analysis is quite valuable in strong markets but can also keep you out of trouble when the market is correcting.
Green Dot (GDOT) looks the most interesting from the long side on a correction while Nike, Inc. (NKE) is too far above support.
How To Profit: No new recommendation.
For more on the markets, you might enjoy some of Tom’s recent articles:
The Week Ahead: Stocks Drop, But Has Anything Really Changed?


