It's interesting to see which global markets have been the strongest and which have been the weakest since last week's low, so MoneyShow's Tom Aspray takes to the charts to see how four global ETFs performed and which one looks the most promising.
The US stock market sagged in afternoon trading with only the Dow Utilities bucking the trend. This, of course, is the least favorite sector according to the latest big money poll from Barron’s. Market internals were 2-1 negative on the day. Once again, several stocks, including Cree, Inc. (CREE) and Lumber Liquidators (LL) were down sharply on earnings disappointments.
The overnight news is supportive for the markets as the purchasing manager’s reports from the EuroZone and Germany came in better than expected. Also, the PMI data from China, which had the market’s concerned, was also slightly better than expected.
The US futures are higher in early trading and the latest reading from AAII shows that the individual investors are getting even more bullish. In Thursday’s poll release, 49.69% were bullish compared to 42.66% last week. The increased bullishness last week, as I pointed out in Is the Individual Investor Right?, suggested that the individual investors may have been buying during last week’s sharp drop.
From a global perspective, it is interesting to see which global markets have done the best and which ones have been the weakest over the past month. Let’s look at the best and worst.
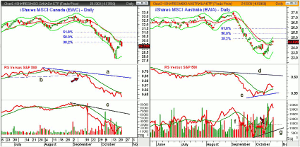
Chart Analysis: The iShares MSCI Canada (EWC) has total assets of $3.10 billion with a yield of 2.02%. There are 90 stocks in the portfolio with over 42% in the top ten holdings.
- EWC peaked at $33.11 on September 4 and hit a low last week of $27.68.
- As of Wednesday’s close, it had rallied 5.6% from this low.
- The 38.2% Fibonacci resistance was just slightly over some as the 20-day EMA was tested.
- The 50% retracement resistance stands at $30.39.
- The daily relative performance dropped below important support (line b) in September.
- This was a sign that it was weaker than the S&P 500.
- The RS line has stayed below its WMA but it was tested this week.
- The volume is now heavy on the rally as the OBV has just tested its WMA.
- The weekly OBV (not shown) is well below its declining WMA.
- There is first support at $28.80 with the daily starc- band at $28.
The iShares MSCI Australia ETF (EWA) has total assets of $1.87 billion, with a yield of 4.03% and a total of 67 holdings. Just over 60% is concentrated in the top ten holdings.
- EWA had a high on September 4 of $27.51 and declined to a low last week of $23.17.
- This was a decline of 15.7% but, as of Wednesday, it had rallied 5.8% from the low.
- The 38.2% Fibonacci resistance is at $24.83 with the quarterly pivot at $25.06.
- The 50% retracement resistance is at $25.34.
- The daily starc+ band was tested Tuesday and is now at $30.08.
- The daily relative performance formed a positive divergence, line e, at last week’s low.
- The RS line is well above its WMA and appears to have completed a bottom.
- The daily OBV also formed a bullish divergence, line g, at last week’s low.
- This divergence was confirmed by the move above the resistance at line f.
- The volume did increase with Wednesday’s lower close, consistent with a pullback.
- The 20-day EMA is at $24.31 with further support at $23.60-$23.80.
NEXT PAGE: Two More Global ETFs to Watch
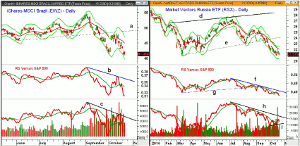
|pagebreak|The iShares MSCI Brazil (EWZ) has total assets of $5.05 billion with a yield of 3.56%. There are 60 holdings in the ETF with 50.9% in the top ten holdings.
- The ETF is down 5.90% YTD but lost almost 20% in the past three months.
- EWZ closed at $44.90 on October 15 after a high on the 13th of $48.08.
- With yesterday’s close, EWZ is down 7.9% in just the past five days.
- The early October low of $41.35 was slightly violated Wednesday.
- The RS line has made marginal new lows with prices and has strong resistance now at line b.
- The OBV shows a similar pattern but, so far, is holding above the recent lows.
- Both the weekly RS and OBV analysis are negative.
- Therefore, this makes the formation of a bullish divergence possible but the OBV would have to move to new highs for the month to confirm.
- There is initial resistance at $43 with the declining 20-day EMA at $44.93.
The Market Vectors Russia ETF (RSX) has net assets of $2.03 billion and a yield of 3.31%. There are 39 holdings in the ETF with 60.3% in the top ten holdings.
- The daily chart of RSX shows the completion of a flag formation, lines d and e.
- Of course, the sanctions and tumbling ruble have hit this market hard as it is down over 27% YTD.
- From the October 15 to the October 22 close, it has lost 2.1%.
- RSX came close to its 20-day EMA last week and it is now at $21.98.
- The recent low is at $20.89 with the daily starc- band at $20.31.
- The daily relative performance dropped below the March-April lows (line g) in August.
- The RS line just made another new low and is well below its downtrend, line f.
- The volume of 27 million shares last Friday was four times the daily average of 6.6 million.
- The daily OBV is barely above its WMA and the support at line i.
- There is strong OBV resistance at the downtrend, line h.
What it Means: Of the two strongest country ETFs, the iShares MSCI Australia ETF (EWA) clearly looks the most interesting, with the daily divergences in the OBV and relative performance. I will be watching the pullback closely to find a good entry point so be sure to follow my Twitter feed for updates and recommendations.
The other three ETFs have quite a bit of exposure to crude oil and the natural resources. The daily analysis of crude oil does not yet suggest a bottom is in place, so they could all decline further.
How to Profit: No new recommendation.


