
Some key large-cap stocks have been hurt by the stronger dollar, but some industry groups are bucking the trend, so MoneyShow’s Tom Aspray takes a technical look at two of these industry groups and a couple of their holdings.
Tuesday’s preopening action was quite ugly as traders focused on the lousy earnings from some key big-cap stocks that had been hurt by the stronger dollar. The sharp drop in Durable Goods before the opening did not help. The Spyder Trust (SPY) opened down 1.2%. The low was made in the first hour of trading as SPY closed with a 1.32% loss.
The Nasdaq 100 was hit the hardest as it lost 2.58%, which was almost five times greater than the loss in the small-cap Russell 2000. The QQQ will look a bit better on this morning’s opening after the very strong earnings from Apple, Inc. (AAPL) and Yahoo.com (YHOO) as the Powershares QQQ Trust (QQQ) is up 1.5% in early trading.
In yesterday’s in-depth technical outlook Buy Apple on an Earning's Miss, I emphasized the strong technical evidence that Apple had completed its correction. In order to setup a good buying opportunity, the stock needed to pullback to support, which could have been in reaction to an earnings miss. Instead, the broad market decline took AAPL back to support and the initial buying zone. In pre-market trading, AAPL is up over 8%.
There were actually some positive developments Tuesday that were almost totally ignored by the financial media’s stock market coverage. The Consumer Confidence soared to 102.9, up from 92.6. This was the highest reading since 2007. New Home Sales surged 11.6% and the PMI Services Index beat expectations. Also, the advance/decline ratios were much stronger than prices.
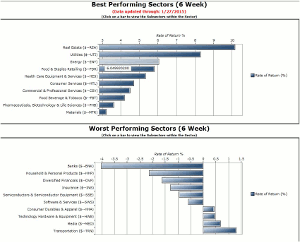
The table above, courtesy of Trade Navigator
Click to Enlarge
In the past six weeks, the Spyder Trust (SPY) has lost 1.4%, but some industry groups are definitely bucking the trend. The table above, courtesy of Trade Navigator, reveals their real estate index is up over 10.1%, followed by an 8.3% gain in utilities. The energy sector rebound has taken the sector up over 6% while the food & staples retailers are up 5.8%.
This is an example of the industry group coverage that is available on some market platforms, as well as online. This gives one a starting point in their stock selection process and I will concentrate on two industry groups and a couple of their holdings.
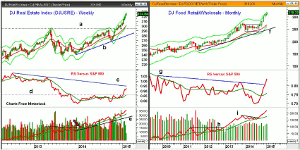
Click to Enlarge
Chart Analysis: The DJ Real Estate Index (DJUSRE) has been bumping into its weekly starc+ band for the past four weeks. The diversified REITs have done the best, up over 13% in the past six weeks.
- DJUSRE broke out above the 2013 high in the middle of November.
- It has gained over 11% since the upside breakout.
- The width of the prior trading range has upside targets in the 340-345 area.
- The weekly RS line completed its bottom in early January as resistance at line d was overcome.
- The RS line is still below long-term resistance at line c.
- The weekly on-balance volume (OBV) completed its bottom in early 2014 as resistance was overcome (see arrow).
- The OBV has been leading prices higher ever since as it has made a series of higher highs and shows a strong uptrend (line e).
- There is initial support in the 320-325 area.
The DJ Food/Wholesale Index (DJUSFD) turned higher in August and has gained over 20% since. It has closed at the monthly starc+ bands for the past three months. The food retailers have done the best, up over 9% in the past six weeks.
- The monthly chart shows that the industry group broke out of a tight range last summer (see highlighted area).
- The upside targets from the chart formation have been met with monthly support now in the 300 area.
- The rising 20-month EMA is at 267.
- The monthly relative performance moved sharply above its WMA at the end of October.
- The RS line has now moved above the long-term downtrend, line g.
- The monthly OBV has done a good job in tracking this industry group as it staged a major breakout in late 2012 as resistance at line h, was overcome.
- The OBV has stayed above its WMA ever since and broke out of another trading range (line i) last September.
Next: A REIT and a Retailer to Watch
|pagebreak|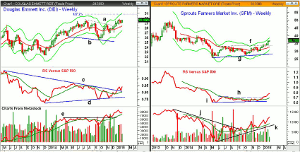
Click to Enlarge
Douglas Emmett, Inc. (DEI) is a $4.28 billion diversified REIT that operates office and multifamily properties in California and Hawaii. It has a yield of 2.90% with an unfavorable current ratio of 0.51.
- The weekly chart shows that a flag formation, lines a and b, was completed at the end of 2014.
- The 127.2% Fibonacci retracement target is at $30.75.
- The quarterly projected resistance is at $31.56 with chart formation targets in the $32 area.
- The weekly RS line broke its downtrend, line c, in early January.
- The RS line has turned up sharply after testing its rising WMA.
- The weekly OBV looks even stronger as it moved through resistance at line e, at the end of October.
- The OBV now looks ready to turn up from its WMA.
- The 20-day EMA is at $29.08 with further support at $28.35.
Sprouts Farmers Market, Inc. (SFM) is a $5.5 billion retailer of natural and organic foods. The stock was down over 11% in 2014.
- The weekly chart shows that a bottom, lines f and g, has likely been completed.
- There is next major resistance in the $40 area.
- The relative performance is rising strongly after completing its bottom formation by moving above resistance at line h.
- This signals that it is now becoming a market leader.
- The weekly OBV broke its downtrend, line j, last September.
- It now shows a strong uptrend, line k, which is bullish.
- The 20-day EMA and short-term support is now at $34.56.
- The former resistance at $33.50 has now become stronger support.
- The rising 20-week EMA is $32.66.
What it Means: Those industry groups that are outperforming the overall market will generally hold up much better when the market corrects. When the stock market is in a strong uptrend, these stocks will generally do significantly better than the major averages.
Though the chart of Douglas Emmett, Inc. (DEI) is positive, the current ratio makes it vulnerable to news and they report earnings on February 10.
Sprouts Farmers Market, Inc. (SFM) needs a significant pullback to reach a good risk/reward buy level but looks very strong for the long-term.
How to Profit: For Sprouts Farmers Market, Inc. (SFM) go 50% long at $34.62 and 50% long at $33.88 with a stop at $32.29 (risk of approx. 5.7%).
Here are some of Tom’s recent articles you might enjoy:
The Week Ahead: Barron's Roundtable—Too Cautious Like 2013?
Three Market Leading Healthcare Picks
Get an Edge from Yearly Charts
Are the Homebuilders Still in a Bear Market?


