
Instead of worrying about the removal of the word ‘patient’ from the FOMC, MoneyShow’s Tom Aspray has concentrated on ‘patiently’ buying the dip; here, he takes a technical look at the major averages and shares his outlook for the weeks ahead.
What will the stock market worry about next? The pullback in the stock market over fears of what the Fed would or would not do likely scared some out of the stock market and turned others bearish. The level of bearish sentiment has increased—as I hoped exactly two weeks ago (Calling All Bears)—as this week’s survey from AAII revealed only 27.16% are bullish. This is down from 47.02% just five weeks ago.
The new high in the NYSE Advance/Decline line on March 1 was a very positive sign. In a series of recent articles, I explained why a major market correction was not likely. Instead of worrying about the removal of patient from the FOMC, I have concentrated on patiently buying the dip in stocks from the market leading sectors like healthcare.
The last three FOMC meetings have been followed by a resumption of the major uptrend and new highs by the major averages. That is why I warned investors last Friday Don’t Get Fooled Again.
The market has been led higher by the small-cap stocks, which I have liked since January. The iShares Russell 2000 broke out to new all time highs on Wednesday, and in this technical review of three other major averages, I share my outlook for the weeks ahead.
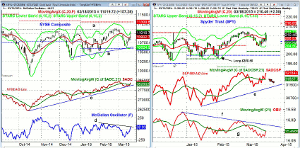
Click to Enlarge
Chart Analysis: The NYSE Composite was up 1.45% Wednesday as the recent correction came close to the support at line b.
- Prices did hold above both the monthly projected pivot support and the quarterly pivot at 10,597.
- The NYSE A/D line dropped down to test the long-term uptrend, line c, but has now moved back above its WMA.
- This makes new highs likely as the A/D line has been acting stronger than prices since February.
- The weekly A/D line also confirmed the recent highs and will turn up from its WMA with a higher close this week.
- The monthly projected pivot resistance is at 11,309 with the weekly starc+ band at 11,559.
- The McClellan oscillator has moved back above its WMA and is likely to break its downtrend, line d, this week.
- Initial support is now at 10,902 and the 20-day EMA.
The Spyder Trust (SPY) dropped down to support at $204.40 last week, which was just slightly below the short-term 50% support level.
- The next targets are at $212.24 and the recent highs.
- The completion of the trading range in February has upside targets in the $216-$218 area.
- The weekly starc+ band is now at $221.40, which is very close to the quarterly pivot resistance.
- The S&P 500 A/D line moved above its WMA on Monday, which was a positive sign.
- It now shows a bullish zig-zag formation and is very close to making a new all time high.
- The volume in SPY yesterday was very high as the lagging OBV has turned up from support at line g.
- The OBV now needs to move through the downtrend, line f, in order to catch up with prices.
- The 20-day EMA and minor support is now at $206.55.
Next: Two Market Leading Averages to Watch
|pagebreak|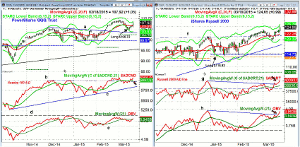
Click to Enlarge
The PowerShares QQQ Trust (QQQ) dropped down to test the breakout level, line a, and the support in the $105 area before turning higher.
- There are still upside chart targets in the $110-$111 area with the weekly starc+ band at $113.96.
- The monthly projected pivot resistance is at $114.89.
- The Nasdaq 100 weekly and daily A/D lines also made new highs at the beginning of March.
- The A/D line is back above its WMA and is already close to making new highs.
- The daily OBV has moved back above its WMA and now needs to move through the resistance at line d.
- The weekly relative performance (not shown) indicates that the QQQ is still leading the SPY.
- The 20-day EMA and initial support is now in the $106-$106.80 area.
The iShares Russell 2000 (IWM) was not up as much as the other averages Wednesday but did close well above the early March high of $123.78.
- The daily starc+ band is at $125.78 with the monthly projected pivot resistance at $129.09.
- The quarterly pivot resistance is even higher at $132.98.
- The Russell 2000 A/D line broke its downtrend, line g, last Friday supporting the bullish case heading into the FOMC meeting.
- The steep uptrend in the A/D line indicates that stocks could still melt up.
- The daily OBV has also broken through its resistance, line h, and is now confirming stock prices.
- The weekly OBV (not shown) is also likely to breakout this week.
- There is initial support now in the $122.26-$123.60 area and the 20-day EMA.
- The RS analysis still indicates that IWM is a market leader.
What it Means: The stock index futures are a bit lower ahead of the opening but the improvement in the technical studies suggests that this is the start of a new rally phase.
If stocks continue to rally the rest of the week, then a pullback would be likely next week.
Only a sharply lower close (20 S&P points or more) would change the short-term positive outlook. Now is the time to raise the stops in these ETFs.
How to Profit: No new recommendation.
Portfolio Update: Traders are 50% long the iShares Russell 2000 (IWM) at $116.88 and 50% long at $114.96. Raise the stop from $114.14 to $117.77 for now.
Traders are 50% long the Spyder Trust (SPY) at $200.80 and 50% long at $200.20. Raise the stop from $197.38 to $202.88.
For the PowerShares QQQ Trust (QQQ) should be 50% long at $107.32 and 50% long at $106.14 with a stop at $102.12.
Yesterday I recommended selling the March 105 Apple calls that were bought at $8.88 or better on January 27. They expire Friday and they closed yesterday at 23.45. I still like the stock and would continue to hold on to your long positions in AAPL.


