Crude oil prices declined for the last four days of the 1st quarter, so MoneyShow’s Tom Aspray studies the charts to determine if they suggest crude oil or the energy stocks will do better in the 2nd quarter.
The 1st quarter ended with a whimper as the Dow Industrials closed the quarter lower while the S&P 500 and Nasdaq Composite were higher for the ninth consecutive quarter. The Dow Transports and oil service stocks held up better than the overall market.
The daily technical studies turned lower with Tuesday’s close as the market internals were slightly negative. The McClellan oscillator has dropped slightly back below the zero line. As I noted Tuesday, the technical studies needed several consecutive days with higher closes and positive A/D ratios to suggest that the correction was over.
Overnight, the S&P futures were hit hard, apparently in reaction to the stronger Yen as they were down over 24 points at one time. They have rebounded from the worst levels but are still lower for the day. Once again, the EuroZone markets are showing nice gains after they also had an early morning selloff.
An interesting article in today’s WSJ—Battered Oil Shows Signs of Life—suggested that a slowdown in crude oil output may be a positive for prices. The money flow analysis helped identify a short-term low for crude prices on February 3.
Crude oil prices declined for the last four days of the quarter, but do the technical studies suggest that crude oil or the energy stocks will do better in the 2nd quarter?
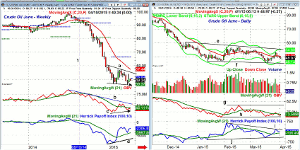
Chart Analysis: The weekly chart of June crude oil contract shows that it made lower lows just three weeks ago as it dropped to $45.93.
- The new quarterly pivot is at $50.91 so a weekly close above this level would be positive.
- The 2nd quarterly pivot resistance is at $56.67.
- The recent swing high is at $57.27 with the declining 20-week EMA at $57.14.
- The weekly OBV did not make a new low with prices, line c.
- The OBV now needs to move above the February high and the downtrend, line b, to confirm the divergence.
- The Herrick Payoff Index (HPI), which uses open interest, volume, and prices to measure money flow, turned negative on August 15 (line 1) when crude closed at $92.75.
- The HPI formed a slight bullish divergence at the recent lows, line d, before it moved above the WMA.
- The HPI is still well below the zero line but its WMA is rising.
The daily chart of June crude oil shows a sideways trading pattern, lines e and f, so far in 2015.
- Crude tested its starc+ band last Thursday before it turned lower.
- The daily starc- band is at $46.17 along with chart support (line f).
- The daily OBV also has not yet made new lows as indicated by line h.
- The OBV needs to move above the resistance at line g, in order to turn positive.
- The daily HPI is holding barely above the zero line with short-term resistance at line i.
- The HPI has also formed a bullish divergence, line j, as it did not make a new low with prices.
- There is initial resistance at $50.41 and the daily WMA.
- There is stronger resistance in the $55 area with the 38.2% retracement resistance from last summer’s high at $65.90.
Next: A Diversified Crude Oil ETF to Watch
|pagebreak|The SPDR S&P Oil & Gas Exploration (XOP) has total assets of $1.52 billion and a yield of 1.32%. It has an expense ratio of 0.35% with 74 stocks in the ETF. It is quite diversified with only 15% in the top ten holdings.
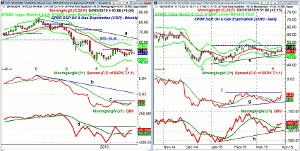
- The weekly chart shows that XOP has rallied from the recent low at $45.80.
- XOP is currently trading above the new quarterly pivot at $49.06.
- The weekly starc band is at $56.65 with the 38.2% resistance at $57.47.
- The 30% retracement resistance is at $62.40 with the downtrend, line a, a bit higher.
- The weekly relative performance is back above its WMA and is trying to bottom out.
- A move in the RS line above the resistance at line c will signal it is a market leader (see stock picker secrets).
- The RS line has further resistance at the downtrend, line b.
- The weekly OBV is back above its WMA but needs to move through resistance at line d, to complete its bottom formation.
The daily chart of SPDR S&P Oil & Gas Exploration (XOP) shows the strong close on Tuesday as it was up 4.34%.
- The rally in February failed to substantially move through the 1st quarter pivot.
- The daily starc+ band and trend line resistance are in the $55-$56 area.
- The daily relative performance also shows a potential bottom formation, line g.
- The RS line is back above its WMA with next resistance at line f.
- The daily OBV has moved back above its WMA after forming higher lows, line h.
- The daily OBV rallied above last November’s high in February as it was stronger than prices.
- There is short-term support at $49.12 and the 20-day EMA.
- The tightest stop would be under the March 16 low of $45.80.
What it Means: For crude oil—with the powerful slide in prices last year—one more marginal new low cannot be ruled out but think it is now less likely. Typically, I would expect prices to form a wide trading range but do not think prices will get back above $66 in the 2nd quarter.
Given the uncertain impact of earnings on energy stocks this quarter, I favor ETFs over stocks until earnings are released. I think it is possible that prices already reflect very poor earnings so they may turn out better than expected. I would not chase XOP at current levels but look for a pullback and the Sector Select Energy (XLE) does look weaker technically.
How to Profit: No new recommendation.


