Historically, April is one of the stock market’s best months and since three social media stocks have been outperforming the SPY by a wide margin, MoneyShow’s Tom Aspray takes to the charts to determine if April is the right time to buy them.
The stock market did what it often does on Monday that is it surprised the majority by posting impressive gains. Over 1% gains in all the major averages and even some of the battered down sectors—like the Philadelphia Semiconductor Index—was up 1.36% on the day.
After the last week of heavy selling, many feared that the market was going to fall off a cliff in Monday’s session. Despite these gains, the market is still not out of the woods yet. The recent new highs in the NYSE, S&P 500, Nasdaq 100, and Russell 200 A/D lines are characteristic of a healthy market. The selling last week did take several of the A/D lines back to important support, which has held so far.
Further gains are needed to turn the technical studies positive enough to be confident that the correction is over. If, instead, we get another day or more of heavy selling that takes the Spyder Trust (SPY) below the $203 level, then the A/D lines are likely to break support, making a decline to the $200 level more likely.
Historically, April is one of the stock market’s best months as—since 1950—stocks have been up 44 years in April and down just 21 years. Even with Monday’s gains, the Spyder Trust (SPY) is up just 1.77% YTD but these three social media stocks have been outperforming the SPY by a wide margin. Is April the time to buy them?
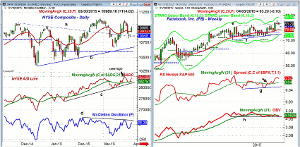
Chart Analysis: The NYSE Composite gapped above its 20-day EMA on Monday and a close back above 11,060 would be positive.
- The monthly projected pivot resistance for April is currently at 11,337 with the weekly starc+ band at 11,445.
- There is minor support now at 10,800 with daily chart support at 10,650.
- The NYSE Advance/Decline line made a new high last Monday.
- It moved back above its WMA last Friday and has now turned up more sharply.
- The McClellan oscillator has moved back above the zero line which is an encouraging sign.
- The oscillator now needs to move through the resistance at line d, to signal that the correction is over.
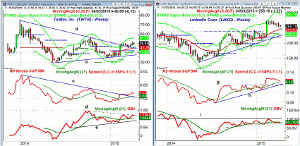
Facebook, Inc. (FB) is up 6.63% YTD and it is easily outperforming the S&P 500.
- The weekly chart shows that the resistance at line e, was overcome two weeks ago.
- The weekly starc+ band is at $89.02 with the monthly projected pivot resistance at $90.99.
- The upside target from the trading range (lines a and b) has upside targets in the $90-$92 area.
- There is initial support on the daily chart at $81.42 and the 20-day EMA.
- Based on current data, the 2nd quarterly pivot is at $80.91 with the rising 20-day EMA at $79.11.
- The last swing low on the weekly chart is at $77.26.
- The weekly relative performance moved above its WMA at the end of February.
- The RS line is now in a clear uptrend, with important support at line g.
- The weekly OBV is in a narrow range and is slightly below its WMA.
- The daily OBV (not shown) did breakout to the upside with prices and continues to look strong.
Next: Two More Social Media Stocks to Watch
|pagebreak|Twitter, Inc. (TWTR) broke through its weekly downtrend, line a, in the middle of February. It is up 3.76% in just the last month and up 39.09% YTD.
- The weekly starc+ band and April’s monthly pivot resistance are both in the $55.57 area.
- The upside target from the weekly triangle formation is in the $65-$67 area.
- The weekly relative performance broke its downtrend, line c, along with prices.
- The weekly OBV was much stronger than prices when TWTR rallied up to $55.99 in October.
- The OBV has just slightly moved above the resistance at line d.
- The OBV tested its rising WMA just four weeks ago, with more important OBV support at line e.
- The 20-day EMA is now at $48.31 with the weekly starc- band at $46.74.
LinkedIn Corp. (LNKD) peaked at $276.18 in February and has been declining steadily for the past four weeks. LNKD is still up over 11% YTD, even though it has dropped 7.6% from its 52-week high.
- The rising 20-week EMA is at $244.83 with the 2nd quarter pivot at $246.99.
- The weekly starc- band is at $228.21 along with the weekly uptrend, line f.
- The relative performance broke through resistance, line g, at the beginning of February.
- The RS line has just been declining to its rising WMA with further support at line h.
- The weekly OBV has not been able to move through the resistance at line i.
- The daily OBV suggests the recent reaction is just a normal correction.
- There is initial resistance at $260 and a close back above $269 would be bullish.
What it Means: These three companies are clearly market leaders, but are also momentum stocks, which makes the risk control more difficult as their daily average true ranges are often quite large.
Facebook, Inc. (FB) and Twitter, Inc. (TWTR) look the best technically as I am waiting for the weekly OBV on LinkedIn Corp. (LNKD) to get stronger.
How to Profit: For Facebook, Inc. (FB) go 50% long at $81.66 or better and 50% long at $80.52 with a stop at $76.73 (risk of approx. 5.3%).
For Twitter, Inc. (TWTR) go 50% long at $48.52 and 50% long at $46.78 with a stop at $44.88 (risk of approx. 5.8%).


