Over the next few months, MoneyShow’s Tom Aspray expects the consumer to shop and spend more than they have during the brutally cold winter months, so he takes a technical look at three stocks to see if they appear ready for purchase.
The stock index futures recovered from the selling early Wednesday but still closed lower. Despite the losses in the major averages, the A/D ratios were positive. The market also reacted to the further drop in the ISM Manufacturing Index as it came in at 51.5 which was the lowest reading since May 2013. Weak exports dragged the index lower as they have declined for the past three months.
The ADP jobs report did not help as it was lower than expected and could mean a weaker than expected monthly jobs report on Friday. Crude oil did manage some nice gains, but from the technical outlook in yesterday’s column, a further rally is needed to suggest that a bottom is in place.
The major averages closed Wednesday slightly above their 2nd quarter pivots and here are the levels to watch: SPY ($204.90), QQQ ($104.63), IWM ($121.39), and DIA ($176.58). The June S&P futures are a bit lower in early trading but still above their quarterly pivot at 2043.75.
One piece of economic data on Tuesday that seemed to be ignored by the financial press was the 101.3 March reading in the Conference Board’s Consumer Confidence This was up from the revised February reading of 98.8 and not far from January’s 7 and a half year of 103.8.
Over the next few months, I do expect the consumer to shop and spend more than they have during the bitterly cold winter months. The monthly review of the Sector Select Consumer Discretionary (XLY) indicates it is still a market leading sector and the charts of these three stocks indicate they could give your portfolio a boost.
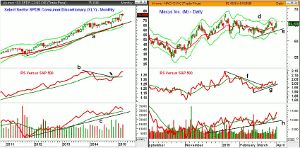
Chart Analysis: The Sector Select Consumer Discretionary (XLY) closed a bit lower for the month but is still up 4.32% YTD considerably better than the SPY’s gain of 0.52%. XLY also has a yield of 1.31%.
- The monthly projected pivot resistance is at $78.64 with the starc+ band at $80.13.
- The monthly relative performance broke its downtrend, line b, in November.
- The RS line is still rising and the weekly is also positive.
- The monthly OBV made a new high in December but has since been declining.
- The OBV is still above its rising WMA and the longer-term support at line c.
- The monthly projected pivot support is at $73.84 with the quarterly pivot at $73.58.
- I will look for a positive signal on a drop down to this support zone.
- The daily chart reveals short-term resistance at $76.15.
Macy’s Inc. (M) was recommended in The Best of Barron's New Year Picks and the daily chart indicates it is very close to completing the correction from the January highs.
- The 1st quarter pivot at $61.99 was tested several times over the past three months.
- Wednesday’s close at $65.49 was above the 2nd quarter pivot at $64.56.
- On a strong close above resistance at line d, the monthly pivot resistance is at $66.85.
- The weekly starc+ band is now at $69.98 with quarterly resistance at $71.72.
- The daily RS broke its downtrend, line f, on March 10.
- The relative performance is now in a short-term uptrend, line g.
- The monthly and weekly RS analysis (not shown) are both positive.
- The volume has picked up over the past few days and the daily OBV has turned up sharply.
- The daily OBV has now moved above its previous high and shows a solid uptrend, line h.
- There is short-term support at $64.50-$65 and then at the recent low of $63.23.
Next: Two More Consumer Stocks to Watch
|pagebreak|Newell Rubbermaid Inc. (NWL) makes both consumer and commercial products. It has a market cap of $10.7 billion with a yield of 1.75%.
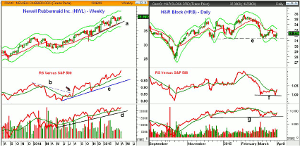
- It is very close to closing the week above the prior two week highs.
- The daily starc+ band is at $40.51 with the weekly at $41.96.
- The quarterly projected pivot resistance is at $42.49.
- The weekly RS line shows a solid uptrend (line c) and has turned up sharply, consistent with a market leader.
- The RS line had broken its downtrend, line b.
- The OBV is also holding above its rising WMA with long-term support at line d.
- There is minor support at $39-$39.50 with the quarterly pivot at $38.47.
H&R Block (HRB) is part of the consumer discretionary sector as the well known tax preparer has a market cap of $8.9 billion and a yield of 2.48%.
- The daily close Wednesday triggered a high close doji buy signal as it was above last Thursday’s doji high of $32.12.
- Next resistance is at $33.29 with the monthly pivot resistance at $33.78.
- The February high for HRB was $35.57 which is a reasonable upside target.
- The long-term support, line e, in the $31.21-$31.30 area has been tested.
- The daily relative performance is trying to bottom, line f, but has not yet started a clear new uptrend.
- The daily OBV has turned up from support, line g, and moved back above its WMA.
- The weekly RS and OBV analysis are both still below their WMAs.
What it Means: The consumer confidence data is consistent with some other polls that suggests the consumer is likely to spend more in the coming months. I will be looking for a new entry in the XLY once the daily studies turn back to positive, watch my Twitter feed.
The initial buy level in Macy’s Inc. (M) was hit and would add to longs now and raise the stop. The positive monthly/weekly studies on Newell Rubbermaid Inc. (NWL) make it a good pick for both investors and traders.
Without positive weekly readings for H&R Block (HRB), it is more suited for traders.
How to Profit: Should be 50% long Macy’s Inc. (M) at $63.28 and would add 50% at $64.34 or better with a stop now at $62.41.
For Newell Rubbermaid Inc. (NWL) go 50% long at $39.76 and 50% long at $38.77 with a stop at $37.23 (risk of 5.2%).
For H&R Block (HRB) traders go 50% long at $32.14 and 50% long at $31.66 with a stop at $30.87 (risk of 3.2%).


