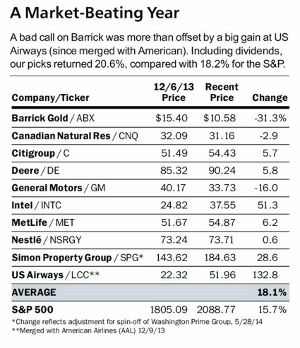
Barron’s top ten picks for 2014 did exceptionally well, so MoneyShow’s Tom Aspray looks at its top ten picks for 2015 basis the monthly, weekly, and daily technical studies to determine which stocks look the best technically.
The lower weekly closes in the Dow Industrials, S&P 500, and the NYSE Composite has kept the short-term momentum negative as the market waits for this week’s FOMC meeting. There were some bright spots as the Dow Transport and Russell 2000 both closed the week higher.
The weekly relative performance analysis reversed to positive on the iShares Dow Jones Transportation (IYT) suggesting it is again a market leader. The Russell 2000 A/D line is leading the other A/D lines higher which is also an encouraging sign. Both the weekly and daily technical outlook suggests the long-term fears over the Fed’s language are misplaced as I pointed out in Friday’s Don’t Get Fooled Again.
Each year, Barron’s publishes their top ten picks for the year ahead. As I have mentioned before, picking stocks to buy and hold for a year is not a reasonable approach for a technical analyst. Though stocks can stay positive technically for a year or more, one needs the flexibility to alter their position based on the price, volume action, or risk.
The picks for 2014 did very well, on average gaining 18.1%, which was 2.4% better than the S&P 500.The big loser was Barrick Gold (ABX) as it was down 31.3%. From a technical perspective, the drop in ABX below the year long support at $15 on September 29 was a reason to get out. This could have limited the loss to 2.6% and increased the average gain to over 21.4%.
The top ten picks for 2015 were published in the December 26 More Gains to Come. Over the weekend, I took a look at all ten stocks basis the monthly, weekly, and daily technical studies. This year’s list includes well known names like Google, Inc (GOOG), Bank of America (BAC), and Gilead Sciences (GILD), but these four stocks look the best technically.
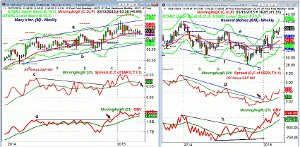
Chart Analysis: Macy’s Inc. (M) is the only retail stock on the list as its stock is down 3.16% YTD.
- The weekly chart shows that after a January high of $67.96, the stock corrected.
- It has been testing the quarterly pivot at $61.99 for the past eight weeks but has not had a weekly close below it.
- There is short-term resistance now at $64.32 with the monthly pivot resistance at $65.86.
- The weekly starc+ band is at $69.30.
- The weekly relative performance moved back above its WMA last week.
- The RS line had completed its bottom last November as it overcame resistance at line c.
- The weekly OBV broke through long-term resistance, line d, in December.
- The OBV has held above its WMA on the correction.
- Both the monthly and daily technical studies are also positive.
General Motors (GM) has been doing well so far in 2014 as it is up 9.86% YTD but was down 11.65% in 2014.
- The weekly chart shows that it broke out of a downward trading range, lines e and f, in January.
- The weekly starc+ band is at $40.77 with the monthly projected pivot resistance at $41.38.
- The completion of the chart formation was confirmed by the relative performance as it moved through its downtrend, line g.
- The RS line shows a bullish pattern confirming GM is a market leader.
- The weekly OBV confirmed the bullish divergence (line i) in November when resistance at line h was overcome.
- The rising 20-day EMA is at $37.19 with four week support at $36.43.
- The strongly rising 20-week EMA is now at $34.79.
Next: Two More of Barron’s Top Ten Picks for 2015 to Watch
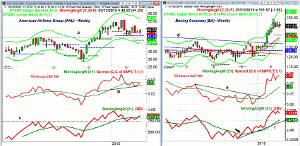
|pagebreak|American Airlines Group (AAL) reversed sharply at the end of January and is now down 12.42% from its 52-week high and is 8.04% lower in 2015.
- There is short-term support now in the $47.50-$48 area.
- The quarterly pivot at $45.34 has held over the past six weeks.
- The monthly pivot support is at $42.43 with the weekly starc- band at $40.90.
- The weekly RS line has turned up and is just a fraction above its WMA.
- The relative performance now has short-term support at line b.
- The weekly OBV has also just moved above its WMA.
- It appears that the OBV has held the support at line c.
- On a close above $52, the next upside targets are in the $58-$60 area.
Boeing Company (BA) has the strongest chart of the ten stocks as it is up 17.31% YTD.
The weekly chart shows the breakout through resistance, line d, at the end of January.
- The sharp rally was in reaction to the strong earnings report released on January 28.
- After the close above the weekly starc+ band, BA has been consolidating.
- There is weekly chart support now at $148.50-$151.
- The rising 20-week EMA is at $139.61.
- BA turned into a market leader a few weeks ahead of the earnings report.
- The RS line is holding well above its rising WMA.
- The weekly OBV moved above its WMA in early November (see arrow).
- It has continued to rise very strongly as volume has been confirming prices.
What it Means: Both General Motors (GM) and Boeing Company (BA) have very strong charts and technical readings. They are currently too far above support and their 20-week EMAs to provide a good risk entry point. They would require a strong correction to take them back to good support.
Macy’s Inc. (M) appears to have completed its correction and looks like a favorable candidate for new buying.
American Airlines Group (AAL) also looks good. United Continental Holdings (UAL) is already part of the portfolio and Alaska Air Group (ALK) was recently recommended. Therefore, I have no official recommendation for AAL as the airline industry group is already well represented.
How to Profit: For Macy’s Inc. (M) at $63.28 or better and 50% at $62.54 with a stop at $60.49 (risk of approx. 3.8%).


