Picking stocks to hold for the whole year is almost an impossible task since some of the best buying opportunities often come during the year, so MoneyShow’s Tom Aspray takes a technical look at four of the stocks that Barron’s had picked at the beginning of the year as favorite income plays for 2015.
As bond yields peaked in the middle of last week, the stock market surprised many by turning higher as the S&P 500 had a new closing high on Friday. There is plenty of economic news for the market to digest this week, and while the bond markets have calmed down, many bond fund holders are still recovering from the recent rout.
Last week’s market strength has improved the outlook from the daily NYSE A/D line suggesting that the correction may be over. Though prices may accelerate to the upside from current levels, a pullback does look likely this week. As long as the selling is not heavy, it will likely be part of the bottoming process. The weekly NYSE A/D line (as shown in this Tweet) is very close to another new high and still shows no signs of a significant correction.
As the major averages remain in their trading ranges, the market continues to undergo a sector rotation with the energy sector now in the corrective mode. The strong rebound in the healthcare and biotech stocks has stabilized their outlook and a higher close this week will indicate that their correction is over.
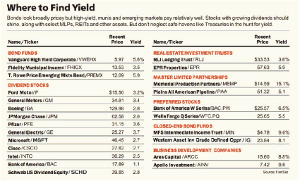
At the start of the year, Barron’s published their favorite income plays for 2015 in Best Income Ideas for 2015. These picks are featured in the table above and I will focus on the dividend paying stocks. The top performer in terms of price gains has been Boeing Company (BA), which is up 14.4%, followed by a 10.9% gain in Pfizer, Inc. (PFE). General Electric (GE) is not far behind as it is up 8.8%.
On the downside was Bank of America (BAC) down 8.3%, followed by the 7.8% drop in Intel Corp. (INTC). As I have mentioned many times in the past, picking stocks to hold for the whole year is almost an impossible task and certainly contrary to my technical market approach.
In looking at these income stocks, I selected those stocks with the most promising weekly charts as well as those that looked the most vulnerable.
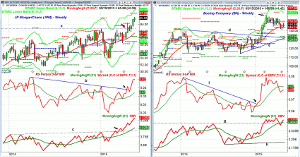
Chart Analysis: The weekly chart of JP Morgan Chase (JPM) shows the close above long-term resistance, line a, the week of April 17.
- JPM is up 6.6% YTD but has gained over 11% in the past three months.
- The monthly pivot resistance is at $67.29 with the weekly starc+ band at $68.39.
- There is first good weekly support in the $63.25-$64 area with the 20-week EMA now at $61.42.
- The weekly relative performance confirmed the price action by also breaking through its resistance at line b.
- The RS line has continued to stay strong as it has made further new highs.
- The weekly OBV led prices higher as it broke through year long resistance, line c, in March.
- The OBV is now well above its sharply rising WMA.
- JPM has a yield of 2.43%.
Boeing Company (BA) broke through year long resistance, line d, at the end of January.
- BA then peaked at $157.82 in February as it closed above its weekly starc+ band (see arrow).
- The correction from the highs has dropped BA 7.5% from its 52-week high.
- The 20-week EMA has been tested over the past few weeks with the recent swing low at $140.43.
- The low fell right between the 38.2% and 50% support levels.
- The weekly RS line broke its downtrend, line f, the week of January 9, which gave advance notice of the price breakout.
- The RS line has dropped below its WMA and the daily RS analysis (not shown) is still corrective.
- The weekly OBV did confirm the highs before the recent pullback.
- The OBV support, at line g, appears to have held as it moved back above its WMA last week.
- BA has a yield of 2.23%.
Next Page: Two Vulnerable Income Stocks to Watch
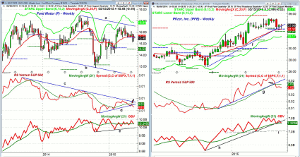
|pagebreak|Ford Motor (F) is up just 1.8% YTD as it is lagging the S&P 500. The close last week was below the quarterly pivot at $15.56 as well as the 20-week EMA.
- On a drop below $15.14, the quarterly projected pivot support is at $14.53.
- The weekly chart shows a pattern of lower highs, line a, as well as lower lows, line b.
- A weekly close back above $16.14 is needed to reassert the uptrend.
- The relative performance dropped below its WMA in the middle of April signaling that it was becoming weaker than the S&P 500.
- The break in the uptrend, line d, is a further negative sign as it likely warns of a further decline.
- The weekly OBV has just dropped back below its WMA.
- There is more important OBV support at line e.
- The daily studies (not shown) are negative but are trying to turn higher.
- F has a yield of 3.55%.
Pfizer, Inc. (PFE) peaked at $35.24 in the middle of April and is now down 4.3% from the highs.
- The 20-week EMA is being tested as has the weekly uptrend, line f.
- On a drop below the recent lows at $33.21, the monthly pivot support is at $32.97.
- The weekly starc- band is at $32.11, which is very close to the 38.2% Fibonacci support at $32.00.
- The 50% retracement support is at $31.10.
- The weekly relative performance broke its uptrend and its WMA at the end of April.
- The RS line has been flat for the past few weeks and is close to confirming a new downtrend.
- The weekly OBV closed below its uptrend on Friday and is now testing its WMA.
- Another lower weekly close will turn the OBV more negative with next major OBV support at line i.
- PFE has a yield of 3.18%.
What it Means: In past articles, I have shown how some of the yearly stock pick lists can often provide material for a good watch list. Some of the best buying opportunities often come during the year—not at the start—so watching these stocks year round can beneficial.
Of the two with the best charts, JP Morgan Chase (JPM) is currently overextended and needs to pullback to stronger support before there is a good buying opportunity. The correction in Boeing Company (BA) may now be over as the OBV reversed to the upside. The tightest stop would be under the $140 area.
Both Ford Motor (F) and Pfizer, Inc. (PFE) are looking increasingly vulnerable so those who are long should watch their position closely.
How to Profit: No new recommendation.


