The decline in bond yields and increase in their prices has been a global affair, so MoneyShow’s Tom Aspray takes to the charts to determine what changes bond fund investors might now consider making in their bond portfolios.
The stock market selling continued on Wednesday but late buying limited the losses. The S&P 500 had an intra-day low of 2067.93 but closed at 2080.15, down 0.45% for the day. The Nasdaq 100 was a bit weaker losing 0.67% while the small-caps bucked the trend as the Russell 2000 gained 0.32%. It is still down 4.6% from the recent highs and the futures are lower again early Thursday.
The carnage in the bond market has been even worse as the WSJ reported that bond king Bill Gross’s new fund at Janus lost 2.7% in the past week. Most bond investors are likely unprepared for such a sharp swing in their bond funds as they are unaware of the potential for capital losses. Of course, the junk bond market has been hit even harder as the iShares iBoxx Investment Grade Corp Bond (LQD) has dropped 3.4% in just the past thirteen days.
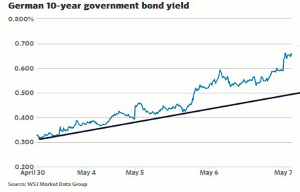
The decline in bond yields and increase in their prices has been a global affair. The chart shows that the yield on the 10-Year German Bund has been rising steadily since the later April lows.
So, what are bond fund investors to do now and what changes might they consider making in their bond portfolios?
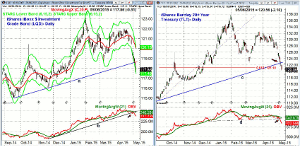
Chart Analysis: The iShares iBoxx Investment Grade Corp Bond (LQD) has assets of $21.47 billion and a yield of 3.34%. The expense ratio is 0.15% and LQD is down just slightly this year.
- The daily chart shows the gap to the downside last Wednesday.
- LQD has been trading at its starc- band for the past week.
- The daily uptrend, line a, was broken on Monday and it now represents first resistance at $118.70.
- The sharply declining 20-day EMA and stronger resistance is at $120.90.
- There is more important resistance in the $121 area.
- The OBV rallied back to its WMA last week before prices plunged.
- The violation of the OBV uptrend, line b, is negative.
- The weekly OBV (not shown) looks ready to close the week below its WMA.
The iShares Barclay 20+ Year Treasury (TLT) has total assets of 5.28 billion with expenses of 0.15%. It has a current yield of 2.66% and is down 3.47% YTD.
- The daily uptrend, line c, was broken earlier this week.
- The 61.8% Fibonacci support from the September 2014 lows has also been broken.
- If the current decline matches the decline from the late January high to the March lows, then the equality target is at $117.54.
- The daily OBV has broken the support, line d, that goes back to December.
- There is initial resistance now at $123 with the declining 20-day EMA now at $126.51.
- The quarterly pivot is much higher at $130.27.
Next Page: Two More Bond Charts to Watch
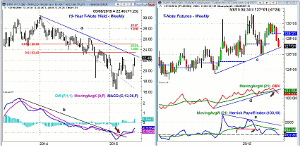
|pagebreak|The weekly chart of the 10-Year T-Note Yield shows the rise in yields over the past two weeks.
- The yields had stayed in a fairly narrow range for most of April.
- The weekly downtrend, line a, is now at 2.290% with the 50% retracement resistance at 2.342%.
- If this is just a rally within the downtrend then the equality target is at 2.451%.
- The 50% retracement resistance stands at 2.505%.
- The weekly MACD broke its downtrend, line b, in late February.
- The MACD has since formed a pattern of higher lows which is consistent with a bottom formation.
- There is initial yield support at 2.100-2.200% with the 20-day EMA at 2.025%.
The T-Note Futures rallied back above the 130 level in early April before the recent decline.
- The weekly uptrend, line c, is now being tested with more important support in the 126 area.
- A weekly close below 125 would be much more negative.
- The OBV broke its uptrend, line d, three weeks ago, before prices dropped.
- The OBV is now below its slightly declining WMA.
- The Herrick Payoff Index (HPI) formed a negative divergence at the January highs.
- This divergence was confirmed by the drop below the intervening low, line f.
- The HPI has dropped below the zero line, indicating that money flow is now negative.
- The prior positive signal in the HPI (point 1) occurred in October 2014 before the sharp rally.
What it Means: On a short-term basis, the decline in the iShares iBoxx Investment Grade Corp Bond (LQD) looks to be overdone. This makes a rebound—or some consolidation—likely over the next week or so.
In contrast to the higher yield LQD, the Vanguard Short-Term bond Index (VBISX)—which has a much shorter duration—is actually up 0.82% YTD.
More importantly, investors should realize that investors in bond funds or ETFs run the risk of capital loss unlike the holders of individual bonds.
How to Profit: No new recommendation.


