
This market has shown impressive resilience, but with skeptics now jumping in, this is a high-risk time for new buying.
The Wall Street Journal’s Wednesday markets column said it all: “The higher it has climbed, the more skeptics it has attracted.” Last week started off with concerns that Greece would not make a deal with its creditors, and a sharp rise in Portugal’s bond yields only added to the pressure on stocks as of Monday’s opening.
Then on Tuesday, the economic data was disappointing and stocks opened weak but still held well above Monday’s lows. This was the “bad news” that I thought the market needed before it could move higher.
The financial media also quickly changed its tune, as one headline on Tuesday read “Poor Economic Data, Euro Stalling, Puts Recovery Rally on the Skids.” As I mentioned on Thursday, bullish sentiment of individual investors dropped 6% from the prior week. Many of the market averages came very close to initial support on Monday before finishing the week much higher.
Despite end-of-month selling, it was a great January, with the SPDR Diamonds Trust (DIA) up 5.5% and the Spyder Trust (SPY) up 7.05%. Of course, the real winners were the PowerShares QQQ Trust (QQQ), up 11.4%, and the iShares Russell 2000 Index Fund (IWM), up 12.3%.
On Wednesday, stocks were boosted by the much better numbers from the ISM on manufacturing, as the index hit its highest level in eight months. Manufacturing data was also positive in China and Germany. The Dow Industrials were up 157 points early Wednesday and the Dow futures were 255 points above Monday’s lows.
Click to Enlarge
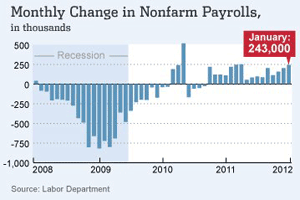
After Thursday’s mixed close, stocks accelerated to the upside on Friday after the non-farm payrolls report was much better than anyone expected. The chart shows a steady improvement over the past four months, which is starting to convince more that the recovery might be real.
This must be making life difficult for many Wall Street strategists. Savita Subramanian, Bank of America’s chief equity strategist, reported that her Wall Street equity sentiment indicator hit a two-year low in January. It is now close to giving a contrarian buy signal.
This is based on the average equity allocation recommended by Wall Street strategists. She said further, “When our indicator has been this low or lower, total returns over the subsequent 12 months have been positive 93% of the time, with median 12-month returns of +23%.”
As I discuss in more detail later, I do not think this is the time to jump on the stock market bandwagon if you have been out for the past four months. The turnaround in early October was the time to buy, as the Advance/Decline (A/D) line had signaled a stock market bottom.
NEXT: What to Watch in the Week Ahead
|pagebreak|The technical action in the emerging markets has also clearly improved, as several of the key ETFs have completed reverse head-and-shoulders (H&S) bottom formations. Many of the emerging currencies are strong, with the Turkish lira and Mexican peso up 6.6% versus the dollar last month. It is likely we will get a new entry point in the emerging ETFs in the coming month.
I’m looking out for more euro shocks in the coming weeks, and I would not be surprised if some of the future economic data also spooked investors. The economic calendar is light this week with jobless claims Thursday, followed by international trade data and consumer confidence on Friday.
WHAT TO WATCH
In the coming weeks, the most important strategy will be to take profits on existing positions as they reach strong resistance and establish new positions only at levels where the risk can be well controlled. The new highs in all of the major A/D lines is positive for the intermediate term, but seasonally, the latter part of February is always a tough time for stocks.
See also: The 4 Key Seasonal Trends for 2012
Click to Enlarge
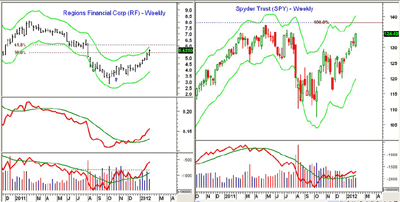
Regions Financial Corp. (RF) is a good example of my recommended strategy. It was recommended on October 25, and the buy level of $3.82 was hit the next day and again in early November.
The weekly chart shows that RF closed this week above the 50% Fibonacci retracement resistance at $5.44 with the 61.8% level at $6.05. For this week, the upper Starc band (Starc+) is at $5.97. (For more on trading with Starc bands, read “Buy, Sell, or Wait: A Way to Decide.”)
Both the relative performance, or RS analysis, and the on-balance volume (OBV) are positive, but the OBV is quite a bit above its weighted moving average (WMA).
I recommended selling half the position at $4.82, which should have been filled on January 18. Even though we are over 16% higher now, I have no regrets about that recommendation. For those who are long, sell the other half at $5.88 or better. Once it tops out, it could fall all the way back to $4.80-$5.00 area, and I think there will be better opportunities elsewhere.
S&P 500
The Spyder Trust (SPY) closed above its 127.2% Fibonacci price target at $133.39 (the high on Jan. 26 was $133.40) on Friday, which does allow for acceleration on the upside.
The next major hurdle for SPY is the 2011 high at $137.18. There is converging resistance now at $138.26, which is the 78.6% Fibonacci retracement resistance, as well as the Fibonacci equality target (100%) from the October rally. The weekly Starc+ band is currently at $140.27.
The weekly OBV is positive and above its weighted moving average, but is lagging the price action. This is in contrast to what is now observed in many stocks. The daily divergence in the OBV mentioned last week warned of the recent pullback, as the 20-day exponential moving average (EMA) was almost reached on Monday.
There is initial support now at $132.50-$133 and a close below last Monday’s low at $130.06 will suggest a drop to the $128.30-$127.20 area. The S&P 500 A/D line moved to new all-time highs last week.
NEXT: Latest Technical Action for Dow, Nasdaq 100
|pagebreak|Dow Industrials
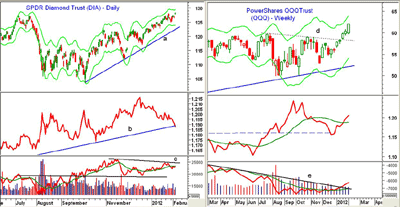
The SPDR Diamonds Trust (DIA), which tracks the Dow, closed the week just below the April 2011 highs at $128.63. The daily Starc+ band is now at $129.45 with the weekly Starc+ band at $134.
The daily RS analysis has been declining since the end of December, as DIA has been underperforming the S&P 500. The uptrend, line b, was broken on Friday. This suggests investors are currently less interested in high-yielding, large-cap stocks. This may change once the market sees a decent correction, however.
Click to Enlarge
The daily OBV has not confirmed the recent highs, line c, and is just barely above its weighted moving average. The daily Dow Industrials A/D line (not shown) has not yet exceeded last month’s highs.
Nasdaq-100
The PowerShares QQQ Trust (QQQ), which tracks the Nasdaq 100 index, gapped sharply higher last Friday and has closed well above the 127.2% Fibonacci retracement target at $61.06. The weekly Starc+ band is now at $63.92, which may stall the rally.
There is a longer-term equality target at $67.15, and for later in the year, there is a cluster of long-term upside targets (see chart here) in the $81.70-$82.47 area.
The weekly RS line is rising strongly, as it moved above its weighted moving average three weeks ago. The weekly OBV has finally broken its long-term downtrend (line h), but is lagging the price action. The Nasdaq-100 A/D line (see chart here) has also broken through resistance and is acting quite strong.
QQQ has first good support in the $60-$60.80 area, with the rising 20-day EMA at $59.68. The breakout level, line d, is in the $58.50 area.
Russell 2000
The iShares Russell 2000 Index Fund (IWM) was discussed in detail last Thursday (see “Small Caps, Tech Still Leading”). IWM was up over 2% on Friday and has next chart resistance in the $83 area. The July 2011 high was at $84.30.
The daily RS analysis broke out to the upside a few weeks ago, indicating that small caps were starting to outperform the large-cap S&P 500 stocks.
There is now minor support for IWM at $80.50 with stronger support in the $78.50-$77 area.
Sector Focus
The iShares Dow Jones Transportation ETF (IYT) closed the week higher and has longer-term resistance in the $98 area. Technicals are positive and RS analysis suggests they are still a leader. The first good support sits in the $92 area.
Click to Enlarge
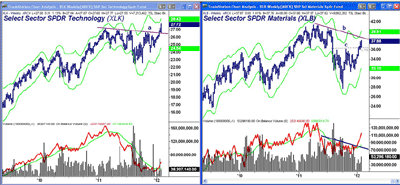
The Select Sector SPDR - Technology (XLK) and Select Sector SPDR - Materials (XLB) had another strong week, up 2.8% and 1.9%, respectively. In contrast, the PowerShares S&P SmallCap Info Tech ETF (PSCT) was up 4.9%.
XLK shows a strong breakout above the resistance from 2011, line. The weekly Starc+ band is not far above last Friday’s close, as it is at $28.43. The on-balance volume is above its weighted moving average but is not confirming the price action.
The weekly chart of XLB has moved above the October highs (line c) while several of the other sectors have not. It is approaching the downtrend from the 2011 highs, line b. The OBV has surged strongly and has broken its downtrend, line d, but is well below the prior highs.
Oil
The April crude contract rebounded on Friday but still closed the week over $2 per barrel lower. I discussed my outlook for crude oil and XLE in this Friday column.
NEXT: Latest Outlook for Gold; Concise Ideas for the Week Ahead
|pagebreak|Precious Metals
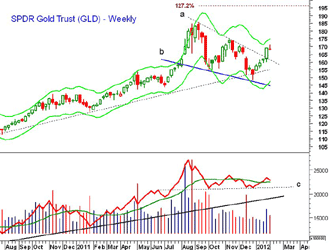
The SPDR Gold Trust (GLD) appears to be completing the first phase of one of the two favored scenarios that I outlined a few weeks ago.
Last week’s rally went a bit further than expected, as GLD hit a high of $171.23 but then closed below the week’s opening and near the week’s lows. This formation, a “gravestone doji,” is not always negative, but does suggest that at the week’s highs, sellers came into the market.
Click to Enlarge
The completion of the flag formation (lines a and b) is positive and does have upside targets in the $196 area. Therefore, a one- to two-week pullback should be a buying opportunity.
The weekly OBV turned down this week and has failed to surpass the prior highs.
There is first good support now at $164.50-$166 with stronger support in the $159-$161 area, a level that should hold on a correction.
The iShares Silver Trust (SLV) failed to reach the next resistance in the $34 area and also closed lower for the week, forming a weekly “doji,” which is a sign of indecision. Next good support for GLD stands at $29.50-$30.50.
The Week Ahead
Though last week’s action reinforced the view that the stock market is quite resilient, there are more reasons to be cautious at these levels while more skeptics finally jump into the market. When this happens, it is usually not the time to buy those stocks that have already had strong gains.
Cleary, there is plenty of money on the sidelines, and if investors ever start to shift from bonds to stocks, we could get the proverbial “melt up.” That is when stocks rise in a parabolic manner, much like gold did last summer. I think it is too early for this now, but after a decent correction, the environment might be right.
For those not fully invested, there are still some good buying opportunities in those stocks which are just starting to move and are close enough to support to control the risk. I will be favoring small- and mid-cap stocks in the materials, technology, and industrial sectors.
Be sure to continue to keep raising your stops and take at least some partial profits on your positions. It is much easier to sell when the market is moving up than it is when it is declining. Have a plan in place for each of your holdings and stick to it.
Next Friday, I will be giving a presentation on RS analysis at the World MoneyShow Orlando. I hope to see many of you there. Visit the Show Web site for details and to register to attend free.
The next Week Ahead column will be published on February 17.
Don’t miss Tom’s latest Trading Lesson, Predicting Price Targets with Fibonacci


