Last week, the action in the stock market was accompanied by a more bullish outlook from the financial media outlets. Though MoneyShow's Tom Aspray rarely pays much attention to the opinions of other analysts, he does see some technical signs that the new bulls may be disappointed.
It was a rocky week for the stock market as the drop in the momentum stocks Tuesday caught many by surprise. The social media stocks bore the brunt of the selling with large drops in Twitter, Inc. (TWTR) and Facebook, Inc. (FB). The action had me wondering last Wednesday whether it was a Momentum Meltdown, Bear Trap or…
The market's rebound Wednesday was followed by even heavier selling on Thursday's opening but the major averages did close well off the day's lows. The action last week appears to have been accompanied by a change in sentiment from the financial media.
In April and May, as well as during June's impressive rally, the dominant opinion from the financial TV networks was that stocks were overvalued and could not go higher. There seemed to be a shift last week as the weakness in the stock market was often discussed as a buying opportunity.
Though I never pay much attention to any economic report, or the opinion of other analysts, I do look for shifts in opinion that can be combined with the technical readings. The dangers of a one-sided view of the market were discussed in early June's Why Following the Crowd Can Be a Bad Idea. In that column, I shared many examples of how the best buying opportunities are accompanied by extremes in bearish sentiment.
Extremes in bullish sentiment are more difficult to identify as close monitoring of the technical studies is required to determine when the market is becoming more vulnerable. Thursday's drop in the US market was precipitated by concerns over a Portuguese bank. That caused heavy selling in the Euro bank stocks as the MSCI Europe bank index has lost more than 13% from the early June highs.
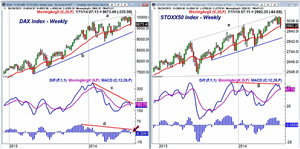
The weekly chart of the DAX Index shows that is it is at the lowest level since late May as it closed the week right on its 20-week EMA. The close was just below the quarterly pivot at 9683. The next good weekly chart support is at 9360-94 with the quarterly projected pivot support at 9316. This also corresponds to the uptrend, line b.
The MACD peaked early in the year and it formed much lower highs last month, line a. This divergence is also visible in the MACD-His (line d) as it turned negative this week. It would take a decline below the February low of 8913 to indicate that a more important top was in place.
The blue chip STOXX50 Index does look better technically than the DAX as it closed the week just above its 20-week EMA. The quarterly pivot at 2988 is being tested as we head into the close of European trading. The quarterly projected pivot support is at 2980 with the uptrend, line f, at 2875.
The MACD has formed a slight negative divergence (line g) and the MACD is close to dropping below the signal line. The MACD-His is still well above the zero line. There is strong resistance now in the 3030-3100 area.
The lack of inflation in the Eurozone has also gotten many investors' attention as have the stubbornly low yields on the US 10-Year T-Notes. These low yields are in contrast to the recent improvement in the economic data. Those bearish on the economy argue that the bond market is correct and the economy is really not as strong as most think.
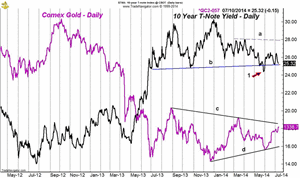
I continue to expect the economy to be much stronger by yearend and therefore conclude that the overseas buying of Treasuries and a flight to safety are keeping rates low. The chart shows that yields spiked to a low of 2.44% in late May as the support (line b), was briefly violated. The yields need to move above 2.80% (line a) in convincing fashion to signal a move back to the major resistance in the 3% area.
Gold prices have rallied nicely from the late May lows as the Comex gold contract is up 7.5% and is now quite close to the weekly resistance, line c, in the $1342 area. There is more important resistance at the March high of $1372. As I noted in Top Timers' Favorite Miners, gold and the gold miners typically bottom in late July. The current sentiment is still quite negative on the precious metals.
NEXT PAGE: What to Watch
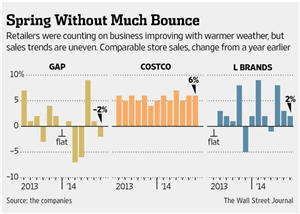
|pagebreak|The strength of the consumer sentiment is still in doubt but Tuesday's Retail Sales report may give us further insight. The same stores sales data last week was mixed as Costco Wholesale (COST) showed a 6% increase in monthly sales while the numbers from the Gap, Inc. (GPS) were negative. Several of the big box stores apparently have seen little benefit from the decline in the unemployment rate.
Also on Tuesday, we get the Empire State Manufacturing Survey, Import and Export Prices, and Business Inventories. Also, Fed Chair Janet Yellen begins two days of Congressional testimony.
The PPI, Industrial Production, and the Housing Market Index are all out on Wednesday with Housing Starts and the Philadelphia Fed Survey on Thursday.
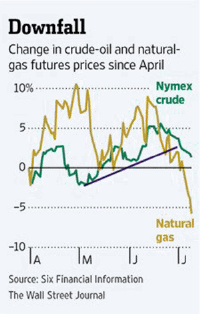
The University of Michigan's mid-month report on Consumer Sentiment will be released on Friday. The recent sharp drop in crude oil prices may help consumers feel a bit better and the chart also shows the plunge in natural gas prices. One of my favorite gauges of the economy, the Conference Board's Leading Indicators, is also out Friday. It has been up in each of the past four months.
What to Watch
The stock market roared into the Fourth of July weekend, but last week, some chinks in the stock market's armor did appear. The recent increase in bullish sentiment has been accompanied by some signs of technical deterioration, which are noted below.
This means that we are likely in the process of building a short-term top. I do not expect the market to drop sharply over the near term, but if it did, that would actually be a positive as it could create an oversold extreme. A more likely scenario is that we will see another rally phase and marginal new highs cannot be ruled out.
This would give the technical indicators and their WMA more time to flatten out before they start to roll over. On the downside, the S&P 500 could drop down to the 1890-1910 level, which is just over 3% below current levels and the quarterly pivot at 1914.
Those stocks with weak relative performance analysis are likely to be the most vulnerable. I do not see enough risk for investors in the well-diversified large-cap ETFs I recommended in A Portfolio That Won't Ruin Your Summer to change their strategy.
For those in individual stocks, they should be looking to reduce their exposure. I took some profits in Alcoa, Inc. (AA) last week after its earnings as it now seems to be on everyone's buy list. I will be reviewing the Charts in Play portfolio next week.
There are some signs of deterioration in the large-cap technology stocks that are now the favorite of most analysts. The weekly and daily charts discussed in last week's trading lesson should be studied if you are invested in any of these.
The bullish percentage for the AAII did not change much last week as it was down less than 1%. The bearish percentage rose 6% as those in the neutral category apparently turned bearish.
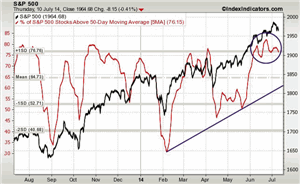
The five-day MA of the % of S&P 500 stocks above their 50-day MAs has dropped down to 76.1% and—as the chart indicates (see circle)—is looking more toppy. And one standard deviation above the mean at 64.7% is definitely in a higher-risk area.
The uptrend, line a, is now in the 57% area but a drop down to the 50% level would not be surprising.
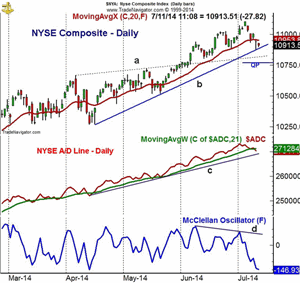
The daily NYSE Composite (NYA) will close the week below its 20-day EMA for the first time since late May. The daily uptrend, line b, was tested last Thursday.
A daily close above last Thursday's high at 10.962 should be enough to stabilize the chart. There is strong resistance in the 11,050-11,105 area with the monthly projected pivot resistance at 11,207.
The former resistance (line a) now becomes first support in the 10,800-850 area with the quarterly pivot 10,758.
The weekly NYSE Advanced/Decline did confirm the recent highs and this is a bullish sign for the intermediate-term. The daily A/D line made a new high in early July but closed the week below its still-rising WMA. This makes the strength of the A/D ratios important on any rally this week. It is still well above the uptrend, line c.
The McClellan Oscillator dropped sharply last Monday as the support from the June lows was broken. At -147 it is slightly oversold. At the February lows it was -198 but at more important levels it can drop as low as -300.
NEXT PAGE: Stocks
|pagebreak|S&P 500
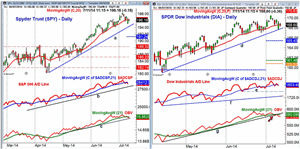
The Spyder Trust (SPY) spiked to a high of $198.29 on July 3 before dropping to $195.06 at Thursday's early low. This is now short-term support with the monthly pivot at $194.42, which corresponds to the uptrend, line a.
The quarterly pivot is significantly lower at $191.24 with the April high and the 38.2% Fibonacci support at $188.80 and $188.35 respectively.
On the upside, near-term resistance at $197.30, which if overcome, could trigger a move to new highs.
The S&P 500 A/D line rose back above its WMA last Wednesday but dropped back below it the following day. The A/D line has important support at the June lows and the trend line support at line b.
The on-balance volume (OBV) made a slightly higher high in early July but has also now dropped below its WMA. It is also close now to the support (line c) that goes back to the April-May lows. There is more important support at the May highs.
Dow Industrials
The SPDR Dow Industrials (DIA) tested the support from the April-May lows, line d, with Thursday's low of $167.70. There is further support at $166.26-$166.66 with the quarterly pivot at $165.45.
The daily Dow Industrials A/D did make a new high with prices but looks ready to close the week just below its WMA. A drop below the June lows, line e, would be more negative.
The daily OBV did not confirm the new highs but dropped below both its WMA and support at line g last week (see arrow). This is consistent with the formation of a top.
Nasdaq 100
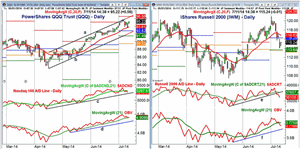
The PowerShares QQQ Trust (QQQ) had a classic test of the upper boundary of its trading channel (line a) before the recent pullback. So far, the 20-day EMA at $93.82 appears to have support with the monthly pivot at $92.82 (courtesy of John Person's software). The monthly projected pivot support is at $91.49.
A close back above $95.40 should signal a move to new highs with the monthly projected pivot resistance at $96.56 with the weekly starc+ band closer to $97.50.
The Nasdaq 100 A/D line surged to new highs at the start of the month but is now slightly below its WMA. There is additional support from the spring lows at line c.
The daily OBV pulled back to its rising WMA last week but did make an impressive new high as the upper trend line was being tested. There is next support at the June lows with the uptrend, line d, much lower.
Russell 2000
The iShares Russell 2000 Index (IWM) has been hit hard since it made an intra-day high of $120.97 on July 1. IWM is already close to the monthly pivot support at $113.64 but looks ready to close the week above the quarterly pivot at $115.05. (For an article with a full list of this quarter's ETF pivot levels, click here.)
The declining 20-day EMA is now at $116.83 with further resistance in the $118-$119 area.
The Russell 2000 A/D never was able to surpass the March highs on the recent rally and has now clearly broken its downtrend. Its WMA is starting to flatten out and a rebound back to its WMA could signal a rally failure.
The daily OBV also did not confirm the highs and is well below its WMA. There is further OBV support at line f.
NEXT PAGE: Sector Focus, Commodities, and Tom's Outlook
|pagebreak|Sector Focus
The iShares Dow Jones Transportation (IYT) held up well last week as it was down just slightly. The daily chart shows an upwardly sloping continuation pattern. There is next upside resistance now at $148.79 with the monthly pivot at $146.03.
The quarterly pivot is much lower at $142.15. The weekly relative performance indicates it is still a market leader and the weekly OBV is still above its WMA.
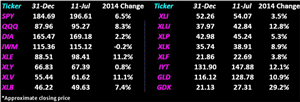
Many of the ETFs have gained in the past two weeks but some, like the Select Sector Financials (XLF) and the Select SPDR Energy (XLE), have not. The Select Sector Utilities (XLU) have been hit with profit-taking recently but is still up 12.8% for the year.
The Select SPDR Health Care (XLV) and the iShares Dow Jones Transportation (IYT) are up 11.1% and 12% respectively.
The PowerShares QQQ Trust (QQQ) is still doing 2% better than the Spyder Trust (SPY), while the SPDR Dow Industrials (DIA) and iShares Russell 2000 Index (IWM) are lagging badly. The IWM is now down for the year. The Select SPDR Consumer Discretionary (XLY) still looks positive but continues to lag the other sector ETFs.
Crude Oil
The September crude oil contract plunged over $3 per barrel last week, after reaching the second quarterly projected pivot resistance at $106.51 at the end of June. The quarterly support is now at $97.95 and the volume has been lighter on the decline than it was on the rally. The weekly OBV is still above its WMA.
Precious Metals
Both the Market Vectors Gold Miners ETF (GDX) and the SPDR Gold Trust (GLD) have continued to rally as they have been up for five weeks in a row. For the GDX, the quarterly projected pivot resistance is at $29.57 while for GLD, it is at $134.07.
The Week Ahead
My bullishness during the choppy spring months has been rewarded over the past six weeks but I am getting a bit more cautious as we head into the second half of July. Tops often do take longer to form than bottoms and Friday's positive close should take away some of the short-term fears that developed last week.
As I discussed in Pick Your Portfolio Strategy, I will tend to use wider stops on sector ETFs and be much more proactive when it comes to individual stocks. This suggests that the new buying opportunities in individual stocks may be more limited and I will be reviewing all open buy orders this week.
I still like the dollar-cost-averaging approach in both an ETF or mutual fund tied to the S&P 500, as well as the large-cap ETFs that I previously recommended in A Portfolio That Won't Ruin Your Summer.
This is because I think you will want to be invested in stocks as we head into the fall months. If you are still in the process of dollar cost averaging, stick with the plan and do not be diverted if market volatility increases further.
Don't forget to read Tom's latest Trading Lesson, What's Next for Big Tech?

