Since gold prices and the gold miners have a seasonal tendency to bottom in late July, MoneyShow's Tom Aspray uses technical analysis to examine the key levels of support for several gold mining stocks.
Though the S&P 500 and Dow Industrials were just slightly lower on Monday, not all market sectors were so lucky. The small-cap Russell 2000 was down 1.7% with both the Philadelphia Housing Sector and Gold-Silver indices down close to 1.50%.
The short-term momentum indicators do allow for a further pullback over the near term with next support for the September S&P 500 futures in the 1950-1955 area with the 20-day EMA for the Spyder Trust (SPY) at $195.98. This is less than 1% below Monday's close. The McClellan oscillator has dropped to -128 and is now below the June lows.
In a weekend article, Mark Hulbert presented the results of Duke University's Campbell Harvey who pegs the fair value of gold at just above $800. He also looks at the relationship of the CPI and treasury yields to gold prices. He concludes that the "odds are poor that the metal will return any time soon to its all time high."
Gold prices and the gold miners have a seasonal tendency to bottom in late July, and technically, the recent rally has been impressive. The volume analysis does suggest that an important low may be in place. The short-term action does allow for a further pullback and the nature of this correction will be important.
In the article, Mark also highlights some of the gold mining stocks that are favored by those advisors with his best rating over the past 15 years. Let's take a look some of the key levels that you should be watching.
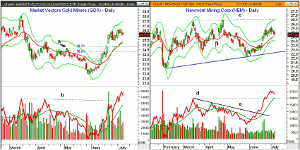
Chart Analysis: The daily chart of the Market Vectors Gold Miners (GDX) shows the impressive rally in June as GDX hit a high last week of $26.69.
- In March, the high was $28.03 with monthly projected pivot resistance at $29.52.
- In 2013, GDX had a high of $31.06 with an all time high of $65.49 in 2011.
- There is short-term support at $25.43 with the 20-day EMA now at $25.33.
- The monthly pivot is at $24.99 while the 38.2% Fibonacci support is at $24.85.
- The projected monthly pivot support is at $23.42 with the 50% support at $24.27.
- The daily OBV moved strongly above its WMA on June 11.
- The highs from early in 2014 (line b) have been overcome, which is a positive sign.
- The weekly OBV (not shown) is above its WMA but has not overcome the March highs.
Newmont Mining Corp. (NEM) was recommended in June when it closed at $24.86. It now has a yield of 2.53%.
- The high last week was $25.72 with an April high of $26.47, line c.
- The 20-day EMA is now at $24.49 with the monthly pivot at $24.39.
- This is very close to the 20-week EMA with the short-term 50% support at $23.94.
- The monthly projected pivot support is at $23.24.
- The downtrend in the daily OBV (line e) was broken on June 12.
- The OBV has now moved to new highs for the year as it is well above the March high, line d.
- This now becomes first OBV support and the weekly OBV (not shown) is also above its WMA.
NEXT PAGE: 2 More Miners to Watch
|pagebreak|Freeport McMoRan Copper & Gold (FCX) has outperformed the S&P 500 over the past three months as it is up 17.8%. It has an attractive current yield of 3.23% which has been supportive for the stock.
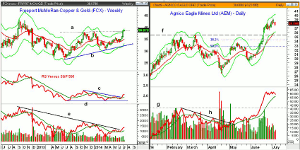
- FCX closed last week above the late 2013 highs (line a) and very near its starc+ band.
- It is now testing the monthly projected pivot resistance at $38.59.
- The quarterly projected pivot resistance is at $39.52.
- The weekly relative performance completed its bottom formation several weeks ago as the resistance, at line c, was overcome.
- The daily RS line is rising sharply and made a new high on Monday.
- The weekly OBV has broken its downtrend, line e, and has moved further above its WMA.
- The rising 20-day EMA and daily starc- band are now in the $36 area.
- The monthly pivot stands at $35.47 which is 8.2% below Monday's close.
Agnico Eagle Mines LTD (AEM) is a $6.6 billion gold mining company with interests in Canada, Mexico, and Finland.
- AEM gapped above strong resistance, line f, on June 19.
- The 20-day EMA is at $35.96 along with the daily starc- band.
- Based on last Friday's high of $39.16, the 38.2% Fibonacci support is at $34.30.
- This is just below the monthly pivot at $34.45.
- The 50% support is at $32.80 with the projected monthly pivot support at $32.80.
- The OBV broke its downtrend, line h, in early May.
- The more important OBV resistance, at line g, was overcome on June 13.
- The monthly projected pivot resistance is at $44.31.
What it Means: A definitive statement on whether gold will surpass its all time highs is an example of the inflexibility that can get you into trouble. There are quite a few key levels that will need to be overcome before one might be able to draw that conclusion.
The impressive volume last month does suggest that the miners can go higher after a reasonable pullback.
Market Vectors Gold Miners (GDX) looks like a buy on a pullback towards the monthly pivot.
Newmont Mining Corp. (NEM) is now in the corrective mode and I am slightly modifying my previous buy levels.
I would not chase either Freeport McMoRan Copper & Gold (FCX) or Agnico Eagle Mines LTD (AEM) until they correct further. Because of its copper exposure, FCX is favored.
How to Profit: For Market Vectors Gold Miners (GDX) go 50% long at $24.94 and 50% long at $24.35 with a stop at $23.33 (risk of approx. 5.3%).
For Newmont Mining Corp. (NEM) go 50% long at $24.31 and 50% long at $23.68 with a stop at $22.79 (risk of approx. 5%).


