
Although it's been a rough couple of weeks for the stock market, it hasn't been the worst October start in history, and, from a technical standpoint, MoneyShow's Tom Aspray thinks a strong rally over the next two weeks could push the weekly studies back into positive mode.
The better than expected monthly jobs data on Friday and the upward revision of the prior month took a bit of fear out of the stock market. It has been a rough past few weeks for the stock market as most in the financial press have focused on October's historically poor stock performance.
The investor wall of worry I mentioned in the middle of September has become even more crowded with last week's fears over Ebola adding to the selling pressure. But this has not been the worst start for October.
As Bespoke Investment Group noted on October 1 "The S&P 500's 1.32% decline today was the tenth worst start to October in the index's history going back to 1928. Somewhat surprisingly, two of the five worst starts to October have come during this bull market as well. On October 1, 2009, the S&P fell 2.58% and then on October 3, 2011 (the first trading day of that month), the index fell 2.85%."
Since the first few Week Ahead columns I have frequently pointed out how the financial media's portrayal of the stock market and economy does a disservice to the average investor. I have encouraged investors to have their own plan in place and to not change their plan because of the financial headlines.
The period from late July 2011 until October 4, 2011 was a classic example of how fears of a new recession scared many individual investors out the market at just the wrong time. On October 3 and 4 of 2011, the S&P 500 dropped 5% from high to low but reversed higher on the fourth to close positive.
Click to Enlarge
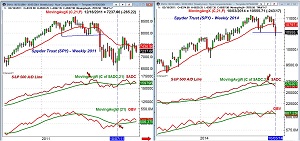
The chart on the left shows the NYSE Composite in 2011 with the week ending October 7, 2011, highlighted on the chart (line 1). From the July high to the early October low, the NYSE Composite declined 26.4% as major support (line a) was violated in early August.
By the end of the first week of October, the weekly on-balance volume (OBV) had moved back above its WMA. The weekly NYSE Advance/Decline had made a new high in early July and by the middle of October was also back above its WMA.
On the right is the current chart up through the close on Thursday as the NYSE dropped 2.4% from the September 30 close to Thursday's low. The current technical review shows that the weekly A/D line made a new high at the end of August and is not below its WMA. The OBV also made a new high at the end of August and has just declined below its WMA.
The sentiment picture is different now than in 2011 as the bullish % dropped to 25.3% two weeks before the market's low. As I noted in last Thursday's Sellers In Charge Now, but..., the latest reading from AAII reveals that 35.4% are still bullish.
From the current chart it is clear that a strong rally over the next two weeks could push the weekly studies back into the positive mode. This could leave the investors who sold in the past few weeks back on the sidelines. The Leading Economic Indicators is one of my favorite economic indicators. Historically it has topped out well before the start of a recession. It continues to look strong, which is another reason not to sell.
The EuroZone markets were hit hard last week as the ECB did not offer the further monetary stimulation that some expected to revive their sagging economies. The economic data was not good either as the Markit's composite purchasing mangers index fell to 52.0 from 52.5.
Click to Enlarge
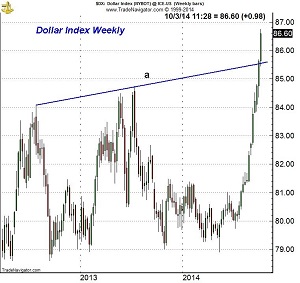
Of course, the euro has been plunging over the past couple of months as the weekly chart of the US Dollar index shows the breakout above the long-term resistance at line a. According to Deutsche Bank, it has risen 11 weeks in a row, the longest streak in the 41-year history of the index.
As we head into earnings season this week, many are worried what this strong dollar will do to the companies that receive much of their revenue from overseas. It will clearly have an impact but it may not show up dramatically for another quarter or two.
NEXT PAGE: What to Watch
|pagebreak|
Click to Enlarge
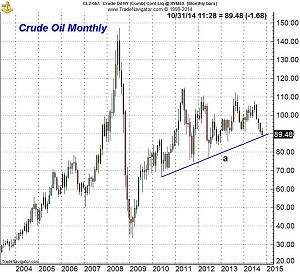
The stronger dollar has been rough on commodity prices as the December crude oil contract has dropped from $103.50 in late June to $88.50 last week. The monthly chart shows that long-term support, at line b, is being challenged with crude making a convincing new low for the year. The lower gas prices should continue to benefit the consumer.
There were a few soft economic reports last week that added to the selling pressure. I sort of expected this last week and warned not to let any one data point change your outlook or investment strategy.
Pending Home Sales were down 1% in last week's report while the Chicago PMI also declined. The Consumer Confidence number really surprised the market as it came in at 86 while the consensus estimate was 92.5. Adding to the concerns was a decline in S&P Case-Shiller Housing Price Index.
Click to Enlarge
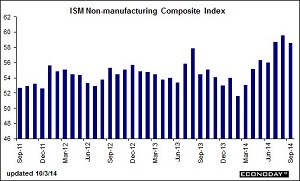
We also got the latest PMI reports last week as the Manufacturing Index and the ISM Non-Manufacturing Index both were down slightly. The Non-Manufacturing index dropped to 58.6. This was down from 59.6 in August but the trend in the chart still looks strong.
The calendar is light this week with the FOMC minutes on Wednesday and then Import and Export Prices on Friday.
What to Watch
As I noted last week, the daily technical studies were solidly in the sell mode but the selling was heavier last week than I expected. The Ebola fears and rumors over capital controls in Russia helped fuel the selling.
The sharp rally Friday brought the major averages well off the week's lows but the daily studies will need more serious days of buying like Friday to move into the buy mode. The weekly studies are holding up much better and could reverse to the upside in the next week or so.
The earnings season starts Tuesday and the reports by the big banks towards the end of the week will likely be important. The financial stocks still appear to be becoming market leaders as the ETFs I recently recommended dropped into good support but turned higher Friday.
I also like the tech sector, which was the focus of last week's trading lesson Four Best Bets in Tech.
It is possible that we saw a selling climax on Thursday but we will not have confirmation for several days as it will require a powerful rally this week. There are some other signs that the market could be bottoming
Click to Enlarge
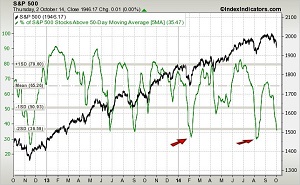
The 5-day MA of the number of S&P 500 stocks above their 50-day MAs dropped to 35.47% on Thursday and is now getting close to the late January and in late July lows. If it turns up this week it will be a positive sign.
The NYSE Composite (NYA) triggered a high close doji buy signal on Friday as it closed above Thursday's doji high. It is still below the quarterly pivot at 10,789 and the 10-day EMA at 10,802.
The 38.2% Fibonacci retracement support from the February lows at 10,584 was broken with last week's low of 10,441. It did hold above the 50% support at 10,422.

Click to Enlarge
The NYSE Advance/Decline Line has tested the August low but now needs to move back above its WMA to stabilize the outlook. A rally in the A/D line above resistance, at line a, would signal that the correction is over.
The McClellan oscillator did form a slight bullish divergence last week (see arrow) and a close above -60 would be a sign of confirmation.
NEXT PAGE: Stocks
|pagebreak|S&P 500
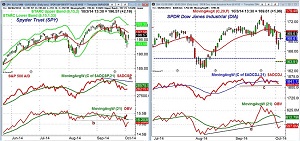
The Spyder Trust (SPY)
closed last Wednesday on the daily starc-
band and dropped well below it Thursday before it rebounded. The close on
Friday was above the quarterly
pivot at $196.19. The declining 20-day EMA is at $197.60 with stronger
resistance now in the $198.30-$199.50 area.
The daily divergence (line a)
in the S&P 500 A/D line warned of a correction but it is still well above
the August low at line h. The A/D line will turn up once Friday's final data is
in but now needs to move above its WMA.
The daily on-balance volume (OBV) is close to its declining WMA but did break support at line b, last week.
Click to Enlarge
Dow Industrials
The SPDR Dow Industrials (DIA)
also triggered a high close doji on Friday and is already testing its 20-day EMA
is at $168.30. The decline has held so far well above the major 38.2% Fibonacci
support at $165.50.
The close above the quarterly pivot at $168.61 is also a positive sign. The next stronger resistance is in the $171-$172 area.
The Dow Industrials A/D line held up pretty well last week and is still above
the short term support at line c.
There was more weakness evident in the daily OBV as it dropped below its
uptrend, line d. The weekly OBV (not shown) will close the week slightly below
its WMA.
Click to Enlarge
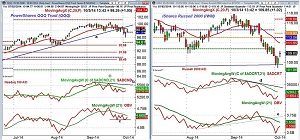
Nasdaq 100
The PowerShares QQQ Trust (QQQ)
gapped above Thursday's doji high on Friday with well over a 1% gain. It
continues to look the best as it is already testing its 20-day EMA. The former
uptrend, line a, is now in the $99.60 area.
The quarterly pivot is at $97.59 as the further support in the $95.50-$96 area and the daily starc- band were tested with last week's low of $95.96.
The Nasdaq 100 A/D line has turned up but is still below its WMA. A move in the A/D line above the bearish divergence resistance in the A/D line (line b) would be positive.
The daily OBV may be forming a short-term bottom at line c. Watch for a move above its WMA to signal heavier new buying.
Russell 2000
The iShares Russell 2000 Index (IWM)
has also rebounded from its lows but was down over 10% from its high during last
week. There is next resistance in the $111-$112 area and the declining 20-day
EMA. The new quarterly pivot is a bit higher at $113.06 with the monthly
projected pivot resistance at $115.
The Russell 2000 A/D line has turned up but still looks weak as it is below its WMA and the major resistance at line d.
The OBV has turned up more sharply but is well below its WMA and the former support, now resistance, at line e.
NEXT PAGE: Sector Focus, Commodities, and Tom's Outlook
|pagebreak|Sector Focus
The iShares Dow Jones Transportation
(IYT)
had a wild ride last week as it was hit hard last Wednesday and then dropped to
a low of $145.92 Thursday before Friday's rally. It looks ready to close near
$151.40 or almost 4% above the week's low.
The daily OBV is close to moving back above its WMA while the weekly is still slightly below its WMA.
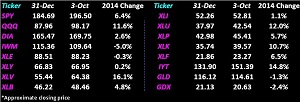
The Spyder Trust (SPY) and the PowerShares QQQ Trust (QQQ) recouped much of their losses by Friday's close with the QQQ up 11.6% for the year.
Click to Enlarge
The SPDR Dow Industrials (DIA) is just up 2.6% while the iShares Russell 2000 Index (IWM) is down 5%.
The Select Sector Health Care (XLV) is now the market leader as it is up over 16% for the year followed by the Select Sector Utilities (XLU) up 12%.
The Select Sector Technology (XLK) is up over 10% and this sector looks to be a favorite heading into the end of the year.
The Select Sector Financials (XLF)
also did not do too badly as it is up 6.5% so far this year.
Interest Rates
The yield on the 10 Year T-Note dropped
below 2.40% last week but closed in the middle of the range at 2.44%. A weekly
close back above 2.65% should be enough to complete a short-term bottom.
Crude Oil
Crude oil closed below $90 for the first time
since April 2013. The weekly and daily chart shows no signs yet of a bottom. As
I noted earlier, the monthly chart is now testing major support.
Precious Metals
The SPDR Gold Trust (GLD)
closed the week just below the late 2013 lows but the technical studies suggest
those lows will be broken. The Market Vectors Gold Miners ETF (GDX)
is still well above its corresponding lows but still looks weak technically.
The Week Ahead
Even though Friday's action was impressive, as I
said last week "there are no signs yet that the correction is over." Some of my
buy levels, like those in the PowerShares QQQ Trust (QQQ)
and financial ETFs were hit last week. They still need a further rally to
confirm my positive outlook.
I am still looking for new opportunities in stocks that are close to good support and show positive volume and relative performance analysis. Once the daily technical studies signal that the correction is over, I will become a more aggressive buyer.
Those not in the stock market should have added a second dollar cost averaging position in the Vanguard Total World Stock Index (VT) on Wednesday September 24. To complete the program, you should make two more equal dollar investments every two weeks with the next on October 8. This will have you completely invested by early November.
Don't forget to read Tom's latest Trading Lesson, Four Best Bets in Tech.


