
Despite the severity of last week’s stock market decline, the number of bullish individual investors rose, surprisingly, so MoneyShow’s Tom Aspray goes to the charts to see if the historically wrong individual investor could be right this time.
Both investors and traders are likely to be relieved that the week is over after the stock market’s rollercoaster ride last week. The action in the overseas markets on Friday did help as the EuroZone markets opened strong with the German Dax up 3.12% on the close.
The even weaker Italian and Spanish markets were also strong with gains respectively of 3.42% and 2.97%. The gains in Asia were less dramatic but the strong close in the US market on Friday could give them quite a boost in Monday’s session. The news on Friday that the Peoples Bank of China was planning on injecting $32.8 billion into 20 large national and regional banks should also be supportive to the Chinese market.
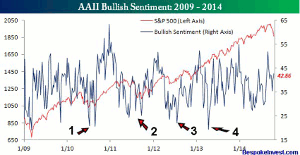
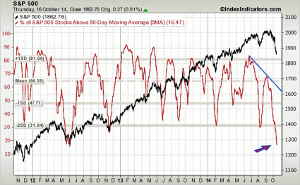
As I noted in last Thursday’s The Best Case Scenario, given the severity of the decline, I was surprised that, according to AAII, the number of bullish individual investors rose to 42.66% from 39.88% the previous week.
Click to Enlarge
Most of you are probably aware this is normally used as a contrary indicator so that very low bullish% readings are often seen at important market bottoms. In this chart from Bespokeinvest.com, I have added some arrows to demonstrate how it is normally used. For example, at the August-September 2010 lows (point 1), the bullish% was under 22%.
Then again, at the August-October 2011 lows, point 2, the bullish% dropped to low levels in both August and September before a bottom was completed. Similar low levels of bullish sentiment occurred at the correction lows in June 2012 (point 3) and in early 2013, point 3.
Last week’s numbers, therefore, would normally be bearish for the stock market as it would imply that the historically wrong individual investor was buying on last week’s drop. However, it is possible that the individual investors are right about the stock market this time.
Click to Enlarge
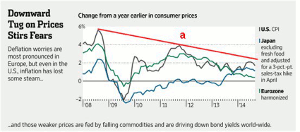
The deflation threat in the EuroZone and Japan is near the top of the investor worry list. The chart shows that both regions are experiencing low and declining rates of inflation, based on consumer prices. The downtrend in the US (line a) is also still intact as they have turned lower recently.
So far, Germany has been objecting to the ECB’s plan to help stimulate the sagging economies as they are still fixating on the austerity program that historically has never worked to stop a deflationary trend. Friday’s comments from the ECB—that bold measures were needed to reform the EuroZone economies—gave the markets a boost.
Click to Enlarge
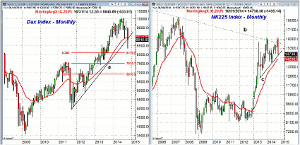
Since the June 2012 lows, there have been many instances when the German Dax Index has led the US market both up and down. The Dax peaked in June at 10,050 and hit a low last week of 8354 as the monthly uptrend (line a) was broken. From the high to last week’s low it had declined 16.9% from its high. The major 38.2% Fibonacci retracement support is at 8111. With Friday’s rally, the Dax closed the week 5.9% above the week’s low.
The chart of Japan’s NK225 shows that it made a marginal new high last month as it has been testing the long-term downtrend, line b, from the 2000 and 2007 highs. The monthly uptrend, line c, has been tested this month with major support now at 13,885.
The economic data last week was mixed with Retail Sales, the Empire State Manufacturing Survey, and Housing Market Index all weaker than expected. On the other hand, the Industrial Production, Philadelphia Fed Survey, and Housing Starts were better than expected.
NEXT PAGE: What to Watch
|pagebreak|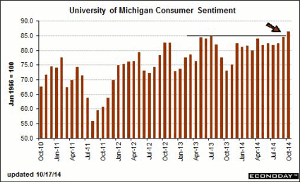
Click to Enlarge
As I have been pointing out over the past few weeks, the economic data continues to indicate a steadily improving economy. The Consumer Confidence last month did show a sharp drop, which had some concerned. Therefore, last Friday’s strong 1.8 point gain in Consumer Sentiment from the University of Michigan was a pleasant surprise.
This week we have Existing Home Sales on Tuesday with the Consumer Price Index on Wednesday. On Thursday, we get the Chicago Fed National Activity Index, PMI Manufacturing Index, as well as the Leading Indicators. The latest data on New Home Sales is out on Friday.
What to Watch
The market’s strong close Friday will have many scratching their heads this weekend. The impressive close well above the week’s lows does suggest that these lows are more likely to hold.
There were rumors that many hedge funds were long crude oil and short bonds. This supposedly precipitated margin liquidation, which is consistent with last Wednesday’s trading.
The market rally was fueled by a surprising 6.3% jump in housing starts as well as strong earnings from General Electric (GE), Honeywell, Inc. (HON), and Morgan Stanley (MS), which were all up sharply in Friday’s session. So far, the earnings reports, despite the dire forecasts have been quite good.
The confirmation of a bottom in the short-term technical studies does allow for a further rally this week. It should go high enough to shake out those market bears who are looking for a 15-20% drop. The rally could take the S&P 500 back to the 1920 area if not the stronger resistance at 1940.
To signal that a v-shaped bottom is in place, the A/D lines will need to break their major downtrends, which would require very strong market internals for a number of days. This makes this week’s action is important.
Click to Enlarge
The 5-day MA of the number of S&P 500 stocks above their 50-day MAs has dropped even further to 16.47% on Thursday. This is almost three standard deviations below the mean at 64.38%. The MA may turn higher this week, so stay tuned.
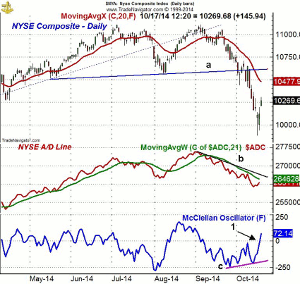
The daily chart of the NYSE Composite (NYA) shows Wednesday’s drop to a low of 9886, as well as Friday’s up gap opening. The decline held above the important chart support at 9732, which was the February low. The major 38.2% Fibonacci support from the June 2012 low is at 9611.
The 38.2% Fibonacci retracement resistance from the high at 11,108 is at 10,349 with the 20-day EMA at 10,475. The 50% retracement level is at 10,494. There is daily chart resistance in the 10,550 area.
Click to Enlarge
The daily NYSE Advance/Decline line has turned up but is still below its declining WMA. There is further resistance at the downtrend, line b, and a strong move above this bearish divergence resistance would be positive.
The McClellan oscillator has formed a three week positive divergence, line c. This divergence has now been confirmed by the strong move above the zero line (see arrow).
NEXT PAGE: Stocks
|pagebreak|S&P 500
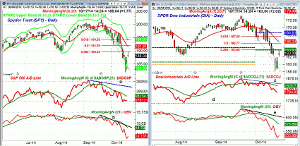
The Spyder Trust (SPY) dropped to a low of $181.92 on Wednesday but held well above these lows in Thursday’s session. The 32.2% Fibonacci retracement resistance at $189.64 was tested on Friday. The 50% resistance level is at $191.90, which is just above the declining 20-day EMA at $191.68.
Click to Enlarge
The daily and weekly starc- band were broken last week with the daily now at $183.47.
The daily S&P 500 A/D line is trying to form a short-term positive divergence and it has held, so far, well above the August lows (see arrow). The A/D line needs to move above its WMA and the early October highs to suggest that a bottom is in place. A move above the bearish divergence resistance, at line a, will signal that the correction is over.
The daily on-balance volume (OBV) has plunged sharply over the past two weeks and is acting much weaker than prices. Typically, it would take a week or two before it could bottom out.
Dow Industrials
The SPDR Dow Industrials (DIA) traded below the daily starc- band last week as the August lows at $163.13 were decisively broken. The daily starc- band is now at $159.32. The low last week was $158.27.
The 38.2% Fibonacci retracement resistance at $163.98 was tested on Friday. The 50% resistance is at $165.77 with the 20-day EMA at $166.24.
The Dow Industrials A/D line declined further last week as it has dropped below the September lows. The A/D line is still well above the August lows (line d) even though prices are much lower.
The daily OBV has declined quite sharply since the start of the month and is now well below its declining WMA. The first test of the declining WMA is likely to fail.
Nasdaq 100
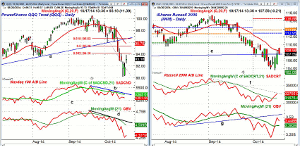
The PowerShares QQQ Trust (QQQ) was finally hit with heavier selling as the quarterly pivot support at $94.61 and the weekly starc- band at $94.17 were both violated. On Wednesday, the low was $90.24 and in Thursday’s trading this low held.
Click to Enlarge
The 38.1% retracement resistance is just above Friday’s high at $94.16 with the 50% retracement resistance at $95.30. The declining 20-day EMA is at $95.79.
The Nasdaq 100 A/D line held firm late last week and is still above the August low, line c. A move above its WMA and the downtrend, line b, will turn the A/D line positive.
The daily OBV turned up Friday but is still well below resistance, line d, and the declining WMA. The weekly OBV (not shown) is just slightly below its WMA.
Russell 2000
The iShares Russell 2000 Index (IWM) tried to form a short-term bottom last week as the $103.54-$104 level is trying to hold. The IWM moved well above its 20-day EMA on Friday but was unable to close above it. The 38.2% Fibonacci retracement resistance is at $109.86.
The Russell 2000 A/D line did form a short-term positive divergence last week and has moved back above its WMA. It is just slightly below the downtrend, line f.
The daily relative performance (not shown) has moved above its WMA and is trying to bottom out. It has to move higher to confirm that the small-caps are leading.
The daily OBV has moved well above its WMA but turned down on Friday. The OBV has next resistance at line g.
NEXT PAGE: Sector Focus, Commodities, and Tom's Outlook
|pagebreak|Sector Focus
The iShares Dow Jones Transportation (IYT) closed higher four out of five days last week. The volume was heavier on the upside than the downside. The week’s low was at $137.05, which corresponds to the March highs.
There is next resistance at $148.25, which was the monthly projected pivot support with the daily starc+ band at $149.85. It was one of the week’s best, gaining 3.5%.
The daily OBV has turned positive as it has moved well above both its WMA and the downtrend resistance.
In the weekly table, I added a column for the weekly change. The Spyder Trust (SPY) is now up just 3.1% for the year and was down 1% for the week. The PowerShares QQQ Trust (QQQ) was down 1.5% last week but is still up 7.4% for the year.
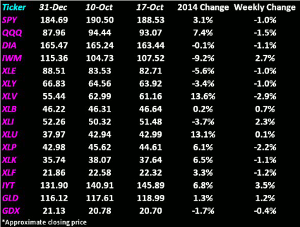
Click to Enlarge
The SPDR Dow Industrials (DIA) is negative both for the week and the year. The iShares Russell 2000 Index (IWM) is down 9.2% for the year but gained 2.7% last week.
The Select Sector Health Care (XLV) is still showing nice gains for the year as it is up 13.6%. It was hit hard last week as it was down 2.9%. The Select Sector Utilities (XLU) is still showing a gain of 13.1% for the year.
The Select Sector Technology (XLK) and the Select Sector Financials (XLF) were both down over 1% for the week but are still higher for the year.
Interest Rates
The yield on the 10-Year T-Note plunged below 2.00% briefly last week as those short bonds were likely forced to cover their positions. The yield closed the week well off the lows at 2.19%.
Crude Oil
The Decembercrude oil plunged even further last week as it hit a low of $79.10 on Thursday. It closed the week at $82.35 but did form a doji. The daily OBV is still negative and shows no signs yet that it has bottomed, though the sentiment is extremely bearish.
Precious Metals
The Market Vectors Gold Miners ETF (GDX) traded sideways for much of the week but then sagged in Friday’s session. The SPDR Gold Trust (GLD) was higher for the week but is still below the quarterly pivot at $120.42.
The Week Ahead
The selling in the market last week was certainly quite a bit heavier than I was expecting last time and there are no clear signs that a significant bottom is in place. There are some signs of a short-term bottom but think a major bottom will take more time to form.
The nature of any rally this week will tell us more of what we should expect as we head into the seasonally positive November. It has been a tough time for stock traders, while those in the more diversified ETFs have had an easier time riding out the storm.
Stock pickers should start to look at the small- and mid-cap stocks as they may be the surprise as we head into the end of the year.
I still recommend the dollar cost averaging program in the Vanguard Total World Stock Index (VT) as the final investment will be made next week. I continue to view this as a correction in the long-term uptrend, as I noted last week, there are no signs of a major top or an imminent recession.
Don't forget to read Tom's latest Trading Lesson, Volume Always Precedes Price.


