
Though many now question the health of this bull market, there are still no clear signs it is over, so MoneyShow’s Tom Aspray highlights how one of his favorite technical and most reliable economic indicators keeps him on the right side of the market.
The sharp increase in volatility and the recent heavy selling in the stock market has many questioning the health of the bull market as well as the economy. There has been a clear increase in bearish commentary from the financial media and we are likely to see a shift in investor sentiment this week.
As of last Thursday, 39.88% of those surveyed by AAII were bullish with just 30.98% bearish. These numbers are not yet consistent with a market bottom as the bullish % typically needs to drop below 30% before the market bottoms.
Though the recent decline has been more violent than I expected and there has been some technical damage, there are no clear signs that the bull market is over. As I have mentioned in past articles, the NYSE Advance/Decline has done an excellent job of keeping us on the right side of the market during this bull market.
Click to Enlarge
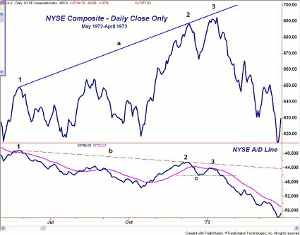
Historically, it has also done a great job of warning us of past bear markets. This chart of the NYSE Composite covers the period from May 1972 to April 1973, which preceded one of the most severe bear markets in recent history.
The NYSE A/D line peaked in May 1972 (point 1) and has the NYSE Composite made higher highs in December 1972 (point 2) and January 1973 (point 3), the A/D line made lower highs. This bearish divergence, line b, is what one typically sees before a bear market begins.
The confirmation of a top came when A/D line dropped below the support, at line c, just two weeks after the high. It is important to note that this divergence took over seven months to develop.
Click to Enlarge
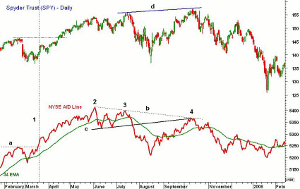
The second chart covers the bull market top in 2007. The A/D line topped out in early June (point 2) but then formed a lower high in July (point 3) as the NYSE Composite and Spyder Trust (SPY) were making new highs.
The severity of the decline in August pushed the A/D line well below its high. As the market rallied from the summer lows, the A/D line was weaker than prices. As the major averages made new bull market highs in early October, the A/D line just reached the downtrend, line b, from the previous highs.
This negative divergence took four months to develop. As reviewed in What to Watch, the weekly and daily NYSE A/D lines did confirm the recent highs and, therefore, could only form a divergence on a rally to new market highs.
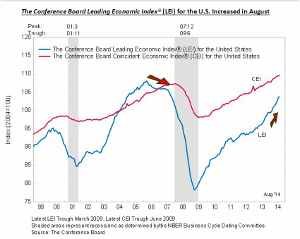
The break of long-term support in the A/D line occurred in early 2008 as the recession officially began. One of my favorite and most reliable economic indicators is the Conference Board’s Leading Economic Index (LEI).
Click to Enlarge
The LEI peaked in 2005 and by the following year was in a clear downtrend. It plunged in early 2007 over a year ahead of the recession’s official start. The LEI is currently rising strongly with the next release on October 23. It shows no signs of peaking out and would likely take six months or more before it develops a meaningful downtrend.
The negative economic news out of the EuroZone—and the concerns over how corporate earnings will fare with such a strong dollar—have combined to drag the stock market lower.
Click to Enlarge
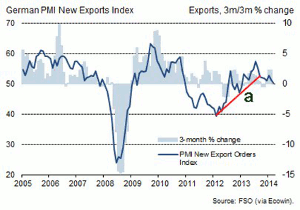
Last Thursday, Germany reported a 5.8% drop in exports, which was the largest decline since 2009. They were up in July, but the PMI New Export Orders Index from Markit has broken its uptrend, line a, suggesting further weakness in exports lies ahead. However, the 10% drop in the euro since May will eventually make their exports more attractive.
NEXT PAGE: What to Watch
|pagebreak|The currency markets have been quite wild, with the Russian Ruble plunging along with crude oil, even though their central bank made a feeble attempt to support it. There are no signs yet of a bottom for crude though it is getting extremely oversold. The technical and seasonal factors for crude continue to point lower, as I discussed last week in How Low Will Oil Stocks and Crude Oil Go?
The bond market is closed Monday for the Columbus Day holiday. The latest reading on the Producer Price Index is out on Wednesday, along with Retail Sales, the Empire State Manufacturing Survey, Business Inventories, and the Beige Book.
The calendar is full Thursday with jobless claims, Industrial Production, the Philadelphia Fed Survey, and the Housing Market Index. On Friday, we get the Housing Starts and the mid-month University of Michigan Consumer Sentiment.
What to Watch
As we head into the afternoon session on Friday, the sellers have once again taken over as the early rally attempts failed. A close at the week’s lows would be a further sign of weakness like the 2.4% drop by the German Dax Index on Friday. It will take more than one sharply higher close to change the short-term outlook.
The earnings season kicks into higher gear this week but it will take some very positive numbers from the big banks to stem the recent selling. The financial sector ETFs, like the Sector Select SPDR Financial (XLF), are still holding above the August lows and more important support, which is an encouraging sign.
With the downside reversal last Thursday, it will take more time before a bottom could be completed as the A/D lines need to break through their bearish divergence resistance. The positive relative performance of the Dow Industrials suggests it is a market leader and quite a few of the Dow stocks are quite oversold.
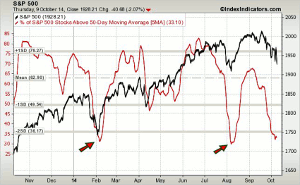
Click to Enlarge
The 5-day MA of the number of S&P 500 stocks above their 50-day MAs closed at 33.1% on Thursday and is now quite close to the late January and late July lows (see arrows). On a one-day basis, the % dropped below 28% and I will be watching for signs that the 5-day MA has bottomed out and turned higher.
The weekly chart of the NYSE Composite (NYA) dropped below the monthly pivot support at 10,408 but is trying to close the week above this level. The weekly starc- band was tested last week. There is additional support at 10,271, which was the April low.
There is more important chart support at 9732, which was the February low. The major 38.2% Fibonacci support from the June 2012 low is at 9611. This is 7.5% below Friday’s close and 13.4% below the early September highs.
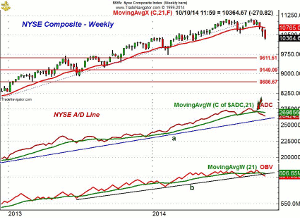
Click to Enlarge
The weekly NYSE Advance/Decline Line made a new high at the end of August and shows a clear pattern of higher highs since last year. The A/D line has dropped below the August lows, which is a sign of weakness. On the next rally, it will need to move back above its WMA to avoid a more complex correction.
The weekly on-balance volume (OBV) also confirmed the recent highs but has now dropped below its WMA and the uptrend, line b. It is still above the August lows.
The McClellan oscillator is still holding well above both the late August and early September lows. Therefore, the bullish divergence is still intact but a strong move back above the zero line is needed before it will turn positive.
NEXT PAGE: Stocks
|pagebreak|S&P 500
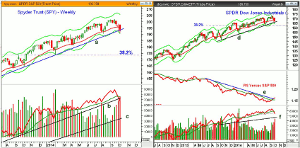
The Spyder Trust (SPY) had a early Friday low of $191.18 as the weekly starc- band was tested. The weekly uptrend, line a, was broken during the week. So far, the August low at $192.49 has not yet been broken. The quarterly projected pivot support is at $190.49.
There is short-term resistance now in the $194-$195 area. The close will be well below the quarterly pivot at $196.19 and the declining 20-day EMA is now at $196.20.
The weekly on-balance volume (OBV) did confirm the new highs but has now dropped below its WMA and the near term support at line b. The long-term OBV support is at line c.
The daily S&P 500 A/D line (not shown) has tested its declining WMA twice in the past week or so. It is still in a clear short-term downtrend and is still well below the key bearish divergence resistance.
Click to Enlarge
Dow Industrials
The SPDR Dow Industrials (DIA) is trying to bounce from the weekly support at line d. It has held, so far, well above the weekly starc- band at $164.76. The DIA has also held well above the August low at $163.13.
The close above the quarterly pivot at $168.61 would be a positive sign with further resistance in the $169.8-170.80 area.
The Dow Industrials A/D line (not shown) is trying to hold above its WMA and has been acting stronger than prices.
The weekly OBV has dropped further below its WMA and violated short-term support. It is still well above the long-term support at line a. The volume was heavy last week and daily OBV continues to act weaker as it has dropped slightly below the August low.
Click to Enlarge
Nasdaq 100
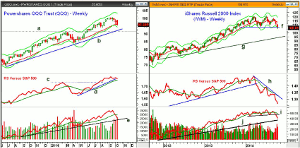
The PowerShares QQQ Trust (QQQ) tested its 20-week EMA last week but is trying to close the week back above it. The quarterly projected pivot support is at $94.61 with the weekly starc- band at $94.17. There is trend line support, line a, at $92.21.
The close this week will be below the quarterly pivot at $97.59 and there is short-term resistance now at $96.50.
The weekly RS line is close to breaking its uptrend, line d, but is still above its WMA. There is more important support at the early 2014 highs.
The weekly OBV did make a new high with prices but has now dropped below its WMA as the selling has been fairly heavy over the past three weeks. The OBV is now coming closer to the uptrend from the August 2013 lows.
The Nasdaq 100 A/D line (not shown) is acting stronger than prices as it is still holding above the late August lows and is barely above its flat WMA.
Russell 2000
The iShares Russell 2000 Index (IWM) dropped below the support, line f, that goes back to November 2013 but may close below it. Still, this is a reason for concern as a decisive break would suggest that IWM could decline to the long-term uptrend, line g, in the $94.40 area.
IWM is just barely above the weekly starc- band at $105.08 with additional support in the $103-$104 area.
The weekly relative performance has plunged even further in the past two weeks and is now well below its downtrend, line h.
The weekly OBV has decisively broken the support (line i), which does suggest that prices will also. The daily OBV also made new lows on Friday.
The Russell 2000 A/D line is still in a clear downtrend but closed above its week’s lows.
There is first resistance now at $108-$108.50 with the declining 20-day EMA at $109.94.
NEXT PAGE: Sector Focus, Commodities, and Tom's Outlook
|pagebreak|Sector Focus
The iShares Dow Jones Transportation (IYT) was hit hard last week as the August low of $142.21 was broken. There is next good support in the $138-$140 area.
The volume over the past three weeks has been heavy, especially last week. The weekly OBV has dropped well below its WMA and the WMA is starting to turn lower.
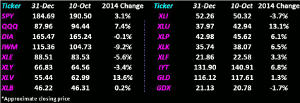
The Spyder Trust (SPY) and the PowerShares QQQ Trust (QQQ) gave up much of the gains for the year as they are only up 3.1% and 7.4% respectively. The SPDR Dow Industrials (DIA) is now up just 0.1% while the iShares Russell 2000 Index (IWM) is down 9.2%.
Click to Enlarge
The Select Sector Health Care (XLV) also declined last week as it is up 13.6% for the year. The Select Sector Utilities (XLU) was higher for the week as it is now up 13.1% for the year.
The Select Sector Technology (XLK) is now up only 6.5% for the year, while the Select Sector Financials (XLF) gave up almost half of its gains for the year.
Interest Rates
The yield on the 10-Year T-Note plunged last week closing at 2.307%. The weekly starc- band is at 2.224%. The weekly MACD-His is still holding its long-term support but did turn lower last week.
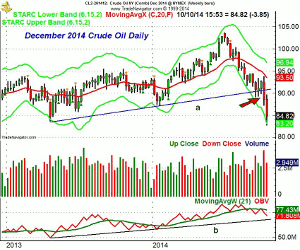
Crude Oil
The December crude oil closed below the weekly support, line a, two weeks ago. The lower weekly starc- band at $83.20 was tested last week. Crude lost $3.70 per barrel last week.
The weekly OBV tested its WMA in late September before turning lower. The OBV is still above the long-term support at line b. There is first resistance now at $89-$90 with the declining 20-week EMA at $93.51.
Click to Enlarge
Precious Metals
The SPDR Gold Trust (GLD) and the Market Vectors Gold Miners ETF (GDX) closed a bit higher last week. The GDX formed a weekly doji so last week’s high at $22.16 will need to be watched closely.
The Week Ahead
The S&P 500 closed just above the 1900 level on Friday with the Dow Industrials down over 100 points. Negative comments by Treasury secretary Jack Lew on Friday afternoon did not help nor did the downgrades by S&P.
I would expect the S&P 500 to bounce from the 1880-1900 area but cannot rule out an eventual decline to the 1850-1870 area before the correction is over. We may see more of a grinding bottom that will take several weeks to form. I will be watching any rally closely.
Those not in the stock market should have added another dollar cost averaging position in the Vanguard Total World Stock Index (VT) last week as it was down 4.5%. If I am right about this being a correction in the long-term uptrend, these dollar cost averaging positions should work out well.
Don't forget to read Tom's latest Trading Lesson, Four Best Bets in Tech.


