There are as many polls that measure as many different sentiments as there are stars in the galaxy, so MoneyShow’s Tom Aspray examines what one specific one says and how the information might be used in your analysis.
The much better than expected jobs report supports the Fed’s view that the winter’s extreme weather had depressed the economic data. This has been my view since February, Will the Spring Thaw Push Stocks Higher? So far, the earnings season has gone much better than expected, and this is also a positive sign.
It has been a rough four months in the stock market and the Spyder Trust’s (SPY) meager gain of 0.7% in April did not help. The bullish enthusiasm that investors started the year with has pretty much dissipated as the collapse in some of the Internet and biotechnology stocks caused many to re-think buying the dip.
As I mentioned a month ago in The Stock Market Is NOT Rigged for Investors, the publicity campaign for Michael Lewis’ book has further discouraged investors from buying stocks. Maureen O'Hara, a professor of finance at Cornell University's Johnson School of Management agrees saying “that talk of stock market ‘rigging’ will needlessly scare investors.”
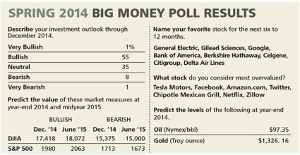
Last week’s Barron’s cover featured the headline Tired Bull and featured their semi- annual Big Money Pool of institutional investors. I read these pool results more carefully to see whether the consensus opinion of these experts could be helpful to the individual investor.
The full article, Just Chillin’, like most of their articles is a good read. If you hurry, you might be able to pick a copy of last week’s issue before this Saturday’s issue arrives or consider their cheap trial subscription. I have no incentive for recommending it and found my subscription worth every penny. The bottom line from the survey is that “Fifty-six percent of Big Money respondents call themselves bullish or very bullish about US stocks today, down from 68% six months ago.”
This excerpt from their table of pool results shows that the bullish advisors, as of the end of March, thought that the S&P 500 would reach 1980 by December of 2014. This is 100 points or 5.2% above current levels. They also were looking for the Nasdaq Composite to challenge the all-time highs in the first half of 2015. It should also be noted that 63% were expecting a 10% or more correction in the next 12 months.
The table includes their most-liked and disliked stocks for the next six to 12 months and 73% thought stocks were fairly valued. Their sector favorites are technology (22%), followed by financials and healthcare at 19% and 12% respectively.
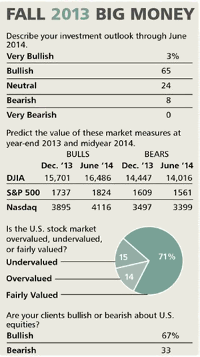
This caused me to review the October poll results, which revealed that, back then, their S&P 500 target for June 2014 was 1824, which is about 60 S&P points below current levels. As I have noted many times, forecasting price levels six-eight months out is a very difficult task.
It was interesting that fewer had a neutral outlook in the fall while the number of bears stayed the same. In October, 67% of their clients were bullish, but as of March, only 31% were still in the bullish camp. In the previous poll, 33% of the clients were bearish, but in the latest survey, only 9% are bearish.
Last fall, in addition to technology, basic materials, consumer cyclicals, energy, and financials were favored by 10% or more. Utilities and the transports were only picked as a best group by 1% in October, and they are still at the bottom of the list. It looks as though they also missed the stellar performance of the utilities in 2014. As I noted last week, there are some signs that utility stocks were ready for a pullback.
In conclusion, I think that these polls can be useful to individual investors and the extreme readings could be looked at as a contrary indicator.
NEXT PAGE: What to Watch
|pagebreak|The uncertainty for the markets remains the conflict in the Ukraine, which does not seem to be getting any better. German Chancellor Merkel urged Russia to take action to lesson tensions after her meeting with Obama on Friday.
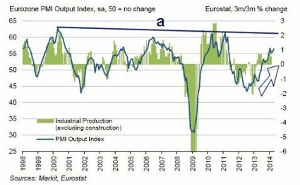
The economic data continues to indicate that the economies of the UK and Eurozone are improving. The data on UK manufacturing is now quite close to breaking out above the highs set in 2010-2011. The chart of the Eurozone Purchasing Manufacturers Index has risen to a three-month high and shows a steady uptrend. It is still below the 2010-2011 highs, line a.
Another good sign from the Eurozone was the report from the European Central Bank that suggested the improving economy has caused a pickup in demand for business loans. It covered 137 banks and the survey reported an increase in all loan categories in the 1st quarter. This may allow the ECB to avoid lowering rates further.
The stock market was helped last week by the economic data as the Dallas Fed Manufacturing Survey was strong on Monday, as was the data on Pending Home Sales, which surged 3.4% in March. The S&P Case-Shilller HPI was up 0.8% while consumer confidence was pretty much unchanged.
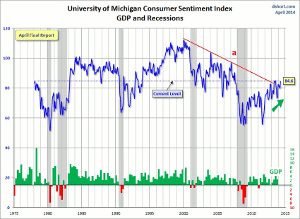
On October 25, the University of Michigan Sentiment Index came in quite strong and this chart (courtesy of www.dshort.com) shows that the long-term downtrend, line a, had already been broken in 2013. Continued improvement over the next few months could confirm the breakout. This would be a clear sign that the consumer was back.
Another positive was March’s sharp rise in consumer spending, which improved at the fastest pace in five years. Economists had predicted only a 0.6% increase and the 2.6% increase on autos and other durable goods is a good sign for the economy.
This Monday, we get the ISM Non-Manufacturing Index, as well as the PMI Services Index. International trade data is out, Tuesday, followed by Productivity and Costs on Wednesday. On Thursday, in addition to jobless claims, we get the Bloomberg Consumer Comfort Index.
What to Watch
The action last week was generally positive even though the market closed lower in reaction to the better than expected jobs data. The reversal from Monday’s lows was a positive sign as the Spyder Trust (SPY) ended the week up about 1.7% from Monday’s lows. This action suggested that the buyers stepped back into the market on Monday.
Last week, I was concerned that the weak close the prior Friday would lead to further selling early last week but it did not. The extent of any decline this week will tell us whether the market is ready for a stronger push to the upside or whether we will get more choppy downward action before the market turns higher.
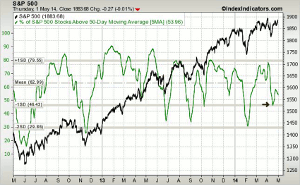
The five-day MA of the % of S&P 500 stocks above their 50-day MAs rolled over last week dropping back to 53% with Thursday’s close. It is still below the mean. which means the risk is moderately low. A drop below the recent lows (see arrow) will suggest a decline to more oversold levels.
As I noted Friday, “Several analysts are turning more bearish on the stock market and individual investors became a bit more cautious this week as the bullish % dropped from 34.5% to 29.77%. This is a positive for the market.”
I continue to favor the large-cap stocks and focused on two in particular on Wednesday. The outlook for the tech sector is mixed though two of the tech giants have interesting long-term charts.
NEXT PAGE: Stocks
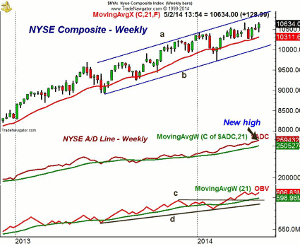
|pagebreak|The weekly chart of the NYSE Composite (NYA) still shows a well-defined upward trading channel with the upper boundary (line a) above 10,900. May’s monthly projected pivot resistance is at 10,920.
The 20-day EMA coincides nicely with the monthly pivot in the 10,530 area with the monthly projected pivot support at 10,373. The quarterly pivot is at 10,270 with long-term support still in the 9900-10,000 area.
The weekly NYSE Advance/Decline made another new all-time high this week and continues to act strong. The daily A/D line (not shown) also made another new high in last week’s trading.
The McClellan oscillator is holding well above the zero line as the breadth was slightly positive even on Friday. A move above the prior high at +116 would be even more positive.
The weekly OBV retested its support, line c, in March and is close to breaking out of its recent trading range. It is well above its rising WMA.
S&P 500
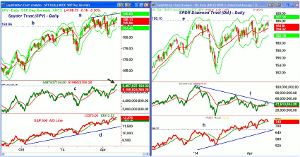
The daily chart of the Spyder Trust (SPY) shows the nice bounce from Monday’s low, line b. The SPY traded in and out of positive territory and was a bit lower going into the close.
There is still key resistance at the early-April high at $189.70 with the monthly projected pivot resistance at $192.83. The weekly starc+ band is now at $193.59.
The daily OBV finally made a new high last week as it overcame the early March high, line c. It had been lagging the price action for some time. Volume did pick up last week and the weekly OBV (not shown) has bounced again from its WMA. Therefore, the OBV multiple time frame analysis is positive.
The S&P 500 A/D also made a new high last week and continues to hold above its rising WMA. The A/D line has first good support at the March and April lows.
The rising 20-day EMA at $186.84 is first support with the monthly pivot at $186.44. The monthly projected pivot support is quite a bit lower at $183.16 and is well below last Monday’s low.
Dow Industrials
The SPDR Dow Industrials (DIA) made a new closing high last week but has still not been able to overcome the intra-day high at $165.93. The monthly projected pivot resistance is at $169.89.
The monthly pivot is at $163.71, which is just below the 20-day EMA at $164.02. There is additional support at $162.78, which was last week’s low with the quarterly pivot at $160.30.
The daily on-balance volume (OBV) continues to act weaker than prices as it turned lower after testing its downtrend, line f. The weekly OBV (not shown) continues to look much stronger as it is close to all-time highs and well above its WMA.
The daily Dow Industrials A/D line did make a new high last week but has since dropped below its rising WMA.
Nasdaq-100
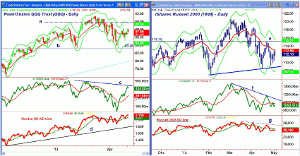
The PowerShares QQQ Trust (QQQ) came close to the April 24 highs at $88.21 late last week but was able to hold above the 20-day EMA at $87.06 and the quarterly pivot at $87.34. There is next resistance at $89.68 to $90.65. The monthly pivot is at $86.78 with further support in the $84.50 area. The $83.28 area, line b, has held in 2014.
The daily on-balance volume (OBV) is just below its downtrend, line c, and an upside breakout would be positive. It is well above its WMA, which is sharply rising and this is a bullish sign. The weekly OBV (not shown) has turned up but is still below its WMA.
The Nasdaq 100 A/D made a new high last week as it bounced off its WMA at last week’s low.
Russell 2000
The iShares Russell 2000 Index (IWM) only had a feeble rally attempt last week as it dropped to a low of $109.32 on Monday. There is next support with the April lows at $108.30. The quarterly projected pivot support is at $108.80.
The rally has stalled below the 20-day EMA at $112.97 and the monthly pivot at $113.04. There is more important resistance at $114.53, which is the quarterly pivot. A close above the recent high at $115.50, line e, would be a positive sign.
The daily OBV is still below its WMA but is trying to stabilize. The weekly OBV turned up last week and is still holding above its WMA.
The Russell 2000 A/D line is still acting weak as it is below the downtrend, line g, and its WMA.
NEXT PAGE: Sector Focus, Commodities, and Tom's Outlook
|pagebreak|Sector Focus
The iShares Dow Jones Transportation (IYT) had a new weekly closing high last week but is still slightly below the prior week’s high at $139.45. This is the next upside target. The weekly starc+ band is at $143 with the monthly projected pivot resistance at $144.15.
The weekly studies are positive as the Aspray’s OBV Trigger (AOT) has moved back above zero. The weekly relative performance still indicates that IYT is a market-leading sector.
The monthly pivot is at $135.97, which is quite close to the 20-day EMA at $136.16. IYT is one of the better performers in 2014 as it is up 4.4%, and we are still holding on to long positions from $130.47.
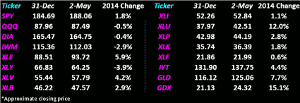
The Spyder Trust (SPY) is now acting a bit better as it is up about 1.9% for the year while the SPDR Dow Industrials (DIA) and PowerShares QQQ Trust (QQQ) are down 0.5%. The iShares Russell 2000 Index (IWM) is still the weakest, down 3.1%.
The Select SPDR Utilities (XLU) continues to lead the sector table as it is up 12%, which is a bit below the highs. I recommended that those with nice profits in the utility stocks prepare for a possible correction by taking some profits.
The Select SPDR Health Care (XLV) is still well below the year’s high as it is up 4.1%. The Select SPDR Energy (XLE) is doing a bit better for the year as it is up 5.9%.
The Select SPDR Consumer Discretionary (XLY) has rebounded but is still down 3.9% for the year, while the Select SPDR Consumer Staples (XLP) is up a healthy 2.6%.
The Select SPDR Financials (XLF) is just up barely for the year as the sharp drop in Bank of America (BAC), which formed a monthly low close doji in April has not helped. (See Friday’s analysis for other stocks that formed monthly LCDs).
The Select SPDR Materials (XLB) is holding up well and added to its gains last week as it is now up 2.9%.
Crude Oil
Crude oil had its lowest weekly close in three weeks as the June contract settled well below the $100 level. The weekly OBV has turned down but is still well above its rising WMA. The quarterly pivot now stands at $98.41 which is about 41.40 below Friday’s close.
Precious Metals
The SPDR Gold Trust (GLD) and the Market Vectors Gold Miners ETF (GDX) closed the week a bit lower but GDX did trigger a HCD buy signal on Friday.
It was recommended two weeks ago in Should You Buy This Unloved Sector, and the initial buy level was hit. The weekly OBV needs a stronger close this week to move above its WMA.
The Week Ahead
Given what the market faced at the start of the week, it was a pretty performance for last week. The intermediate-term analysis remains clearly positive while the short-term action suggests we may see choppier trading over the near term.
The stocks in the Charts in Play portfolio continue to hold up quite well (To see the whole portfolio, go here) We are still doing some selective buying and are long both the Spyder Trust (SPY) and PowerShares QQQ Trust (QQQ).
The Vanguard Emerging Markets (VWO) appears to have completed its pullback, and I will be looking for an entry level next week. Those who followed the dollar cost averaging program from last August are now well in the black.
Also, I would continue to stay with the dollar cost averaging positions in the S&P 500-tracking ETF that I discussed in the January 24 column, A Path to Investing Success in 2014.
Those who were not in the market should have started a dollar cost averaging plan on April 11 as the S&P 500 had closed below 1830 the previous day. Another equal purchase should have been made on April 25 and again last Friday. The program should be completed by one more equal dollar amount purchase on May 16.
For those who are still not in the stock market you might consider the large cap ETFs that I discussed in 2 Bear-Beating Large-Cap Picks as they have a low cost ratio and are normally not very volatile as they are broadly based.
As I always recommend, take some time to review your portfolio this weekend while the markets are closed.
Don't forget to read Tom's latest Trading Lesson, My Four Favorite Research Sites.

