Josip Causic of Online Trading Academy outlines six steps every option trader should be taking before entering a direction option trade.
This article will demonstrate a possible way to trade "optionable" stocks, even on IPOs. Although a specific example will be utilized for this article, we are not specifically recommending the buying or selling of the underlying discussed here. This example is used strictly for educational purposes.
There are six systematic steps that an option trader should go through when trading options (whether IPO or not):
Step 1: Read the Fundamentals
Everything starts with the
fundamentals...and in this day and age, the fundamental data is so readily
available on the Internet that there is absolutely no excuse not to
look it up.
For instance, the Dunkin Brands Group (DNKN) ticker can be typed into the Yahoo! Finance page. On the left side on the very bottom, we can find the Income Statement, Balance Sheet, and Cash Flow. Figure 1 shows some data:
The only tricky thing in reading these statistics is that you have to read them in the opposite way Johannes Gutenberg has conditioned us to read. The human eye can read in any direction, and reading from left to right is not the one and only way to do it, just because someone in Germany back in the late Middle Ages decided it was convenient for his movable-type printing machine.
The point of interpreting the Total Revenue on the annual basis is to observe whether the numbers are increasing or decreasing. Look right to left.
Step 2: Read the Technicals
Without getting too deep into
it, we should emphasize that it is wise to look for the Sympathy Move-meaning if
one stock, mostly the leader, in a certain sector goes up or down, most likely
it would bring the others in the industry with it.
For instance, DNKN is in the Services Sector and Restaurant Industry. (This data was also pulled out from the Yahoo! Finance page on the left side under the Company Profile, all at no cost to us, the stock researchers.)
Just below this is the Competitors tab, which shows Starbucks (SBUX) and Yum! Brands (YUM). We should really look for a similar size market cap, but in this case for educational purposes, we selected the leader-SBUX.
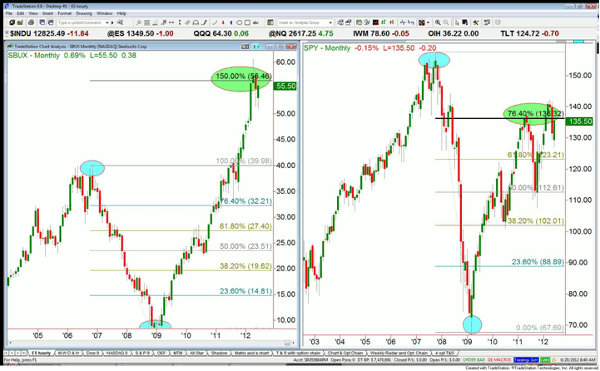
The chart below shows SBUX on the left and the SPDR S&P 500 (SPY) on the right. When compared side by side, we can observe that both charts have blue oval markings. Each oval marks the high in 2007 and low in 2009; whereas the green oval marks the current price with Fibonacci Lines on it.
As can be seen from the figure above, SBUX recovered from the slump much better than the general US market did. Hence, going along with the concept of trading long the strongest underlying in the strongest group, we are making just a slight variation by buying DNKN instead of SBUX.
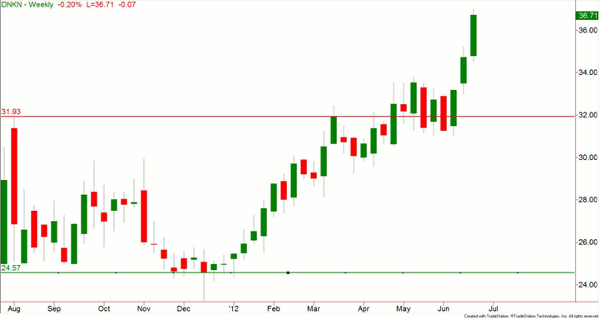
The next figure shows the chart of DNKN with a red line marking the initial high of its first few months of trading, and the horizontal green line marking the low.
The lesson for trading IPOs is quite simple: once the high on the IPO is taken out and the price action does not fall back into the range (on our chart in between the green and red lines), one could cautiously proceed by going long. There is virtually nothing blocking the IPO to go higher, for it is another Christopher Columbus traveling in uncharted territory.
Personally, I prefer to enter at the retest of the old resistance, which should act as new support.
Step 3: Gauge Volatility
The data for the figure below
was taken from another free Web site, CBOE.com, and it shows that at the time of
writing, DNKN's implied volatility is in the lower range.
The 29% is 12 points away from its historical low of 17.75%; whereas on the top side it is even further away, 17 to be exact.
Next, knowing this info does not mean that we should blindly go long an option. All that the IV is telling us is that it is acceptable for us to be premium buyers. What type of buying are we talking about? Calls or Puts? The choice depends again on our technicals.
Step 4: Correct Position Sizing
This is one of the most
crucial steps of trading options, for it's very easy to oversize a position.
When trading a new product, send in a single lot (contract) just to learn how it moves, then as it moves in the anticipated direction, scale in. The figure below shows the history of my trades, closed and open:
Step 5: Entry and Active Monitoring
The graphic of my
option trading platform above shows that I was consistent with the size, and as
a side note the reason why I purchased September 2012 on the first leg rather
than the January 2014 LEAPS is simple: they were not listed at the time
of my long entry into the September call. I purchased as far out as I could have
at the time.
Keep in mind we are dealing with IPOs. The market makers and exchanges list a limited amount of options at first, just to see if there is demand for it. As the demand kicks in, they add more strikes and cycles.
Read Step 6 at the Online Trading Academy Web site here.
Josip Causic is an instructor with Online Trading Academy.


