Technician Corey Rosenbloom, of AfraidToTrade.com, takes to the charts to study this electronic commerce and cloud computing company, updates his current trading levels, and discusses key levels to watch moving forward.
What levels are key for traders in Amazon.com (AMZN) now?
Based on these levels, what are the Price Planning Pathways to targets?
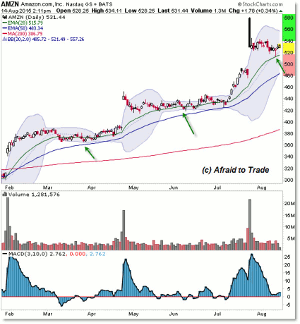
Let’s start with the daily chart and update our trading levels:
Amazon.com (AMZN) developed a Gap and Consolidate…then Rally Pattern through 2015 as drawn.
After an initial earnings gap, shares consolidate and support on rising moving averages.
The next swing or pathway has been an upward rally into the future.
We’re balancing the odds of this pattern repeating a third time on the July gap and consolidation.
If so, notice the support reversal candle off the $520.00 per share level at the rising 20-day EMA.
We’ll be bullish above the $520 pivot and breakout trigger bullish above $540.
A bearish sell pathway develops under the 20-day EMA near $520.
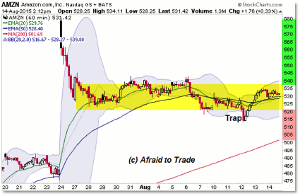
Let’s zoom-in the perspective to see these levels closer:
A quick glance at the hourly chart of Amazon (AMZN) reveals the sideways rectangle range between the simple, easy-reference levels of $520.00 for support and $540.00 for resistance.
We’ll continue playing ping-pong with price between this range as detailed.
However, a firm upside breakout on higher volume above $540 and $543 could trigger another bullish swing higher toward $570 or beyond; it’s the Bullish Price Pathway.
Otherwise, we do note one Bear Trap under $520 that was immediately bought and supported.
Like a Magnet, the $530 level is the Midpoint Reference Level for price.
In the alternate thesis event that price does break and sustain under $520, then a Bearish Sell Pathway opens to traders down toward $500.
Focus on the hourly chart levels when planning and trading Amazon here.
By Corey Rosenbloom, CMT, Trader and Blogger, AfraidToTrade.com


