The stock market reversal Wednesday likely caught many bears by surprise but further gains are needed to squeeze those on the short side. Moneyshow’s Tom Aspray discusses a popular bond market indicator to gauge the sentiment of market professionals.
Quite constructive action in the stock market on Wednesday as the early decline in the S&P 500 E-Mini futures violated the prior three-day lows before stocks reversed to the upside over encouraging news on the fiscal cliff negotiations. The futures closed at new rally highs and have added to these gains early Thursday.
The intra-day reversal has clearly improved the technical outlook and sets the stage for a test of the Spyder Trust (SPY) resistance in the $143-$143.70 area. A test of this level will make a retest of the mid-November lows less likely.
As the investing public continues to pull money out of stocks, the bond market pros continue to favor the bond market as they are still buying bonds and selling notes in anticipation that long rates will fall faster. This is the well known NOB spread that I discussed in May when I pointed out the stock market sell signal from this indicator at the April highs.
As long as this spread continues to move higher many professional traders feel a major new stock market rally is less likely. The seasonal expert, John Person, tells me this is typically a time period when the bond market tops out but he has not yet gotten any major sell signals.
So what should traders and investors be watching so that they can spot the next important turn in the interest rate markets?
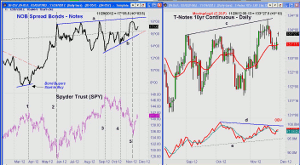
Chart Analysis: The NOB spread (long bonds – short T-notes) formed higher lows in early April (line 1) as the SPY was making higher highs and rose until the stock market bottomed in June, line 2.
- The NOB spread has stayed in a broad range since June but has made higher highs, line a.
- The spread formed a spike low in September as stocks were topping out (line 3) and shows a solid uptrend from these lows, line b.
- It would take a break of this support and drop below the late October lows to suggest that the spread has topped out.
- As the stock market rally stalled early in the week the spread has again tried to turn higher.
- A failed test of the spread’s resistance, line a, could signal a more sustainable stock market low.
The daily chart of the T-note 10-year futures contract shows that they have gapped higher in early trading on Thursday. There is major resistance in the 134 to 134-16 area (134 16/32) as indicated by line c.
- The higher highs in the T-notes have not been confirmed by the daily on-balance volume (OBV) as it has formed lower highs, line d.
- The OBV has moved back above its WMA and a break through resistance will signal a move to lower yields.
- A violation of the longer term OBV support, line e, will signal that rates have turned higher.
- It would take a break below the 133-08 level to weaken the uptrend from the October lows.
- There is more important support in the 132-16 area.
NEXT PAGE: Rally Sets Up Potential Profit Opportunities
|pagebreak|The iShares Barclays 20+ Yr Treasury Bond (TLT) is a $3 billion ETF that currently yields 2.78% and has an expense ratio of 0.15%.
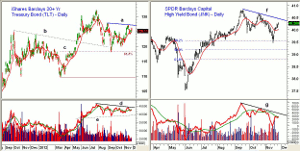
- In September, TLT tested the 61.8% Fibonacci retracement support at $118.35 that was calculated from the May lows.
- This was a drop of 10.7% from the July highs at $132.21.
- TLT hit a high of $127.19 recently, which was just below the August high of $127.72, line a.
- A strong move above this level will signal that long rates are again moving lower and that TLT is likely to test its all time highs.
- The daily OBV is also locked in its trading range with resistance at line d and support at line e.
- I would watch the OBV as it could lead prices on an upside breakout.
- The weekly OBV (not shown) is holding above its WMA and is positive.
- Initial support now at $124-$124.50 with stronger at $122.50-$123.
SPDR Barclays Capital High Yield Bond (JNK) is a $12 billion dollar ETF with an expense ratio of 0.40% and a current yield of 6.89%.
- The fear that dividend tax rates would be increased hit JNK hard as it dropped from an October high of $40.68 to a recent low of $39.45.
- This low violated the 38.2% Fibonacci support from the May lows but did not close below it. The 50% support level is at $39.17.
- The rebound from the lows has taken it above its 20-day EMA with next resistance at $40.45.
- A close above the October 17 high at $40.68 will confirm that the correction is over.
- The daily OBV still shows a pattern of lower highs, line d, and lower lows.
- The daily OBV is now barely above its WMA while the weekly (not shown) is still well below its WMA.
- Initial support now at $40.01 and the rising 20-day EMA with further at $39.85
What it Means: The strong volume in the December T-note futures over the past few days is a short-term positive favoring higher prices and lower yields. If the corrective patterns are completed it could dampen the stock market’s rally.
Many of the very high-yield mortgage backed REITS like Annaly Capital Management (NLY) have rallied back to first strong resistance. As I discussed on November 14, this rally in my opinion is an opportunity to lighten up on long positions.
If we get confirmed new buy signals for TLT, I will be looking to the long side as I favor it over JNK.
How to Profit: No new recommendation
Portfolio Update: For those who went 50% long the ProShares Short S&P 500 (SH) at $34.93 and 50% long at $34.74 as recommended yesterday, keep the stop at $34.08 (risk of approx. 2.1%). On a move above $35.55, raise the stop to $34.58. Follow me on Twitter for updates on this and other positions.


