With renewed fears of the fiscal cliff and some new concerns over the euro crisis, what is an investor to do? MoneyShow’s Tom Aspray takes a technical look at the stock market and has some suggestions for the best course of action.
Stocks were able to hold at higher levels for a good part of Tuesday’s session but afternoon comments from Senator Reid brought in the sellers as he dampened hopes for a quick fix to the fiscal cliff. These new concerns offset the much better data on consumer confidence, which rose to its best level since February 2008.
The consumer confidence also revealed a jump in those planning to buy a home in the next six months. This fits in nicely with the sixth consecutive monthly gain in housing prices from S&P Case-Shiller. There was not much reaction in the homebuilding stocks but I am still looking for a buying opportunity in the next few weeks.
The stock index futures are down in early trading and over the near-term stocks do look ready to give back some of their recent gains. Investors are still clearly nervous as during the week ending November 21 they pulled $9 billion out of stock funds.
A few weeks ago in Don't Jump Off the Fiscal Cliff, I cautioned investors not to change their investment strategy because of fears over the impasse in Washington. Now that the S&P 500 has bounced 4% from the mid- month lows and reached key retracement resistance, what should investors do?
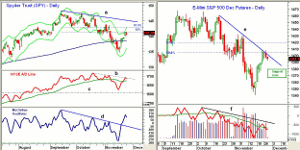
Chart Analysis: The daily chart of the Spyder Trust (SPY) shows that the 50% Fibonacci retracement resistance at $141.44 has been reached as the daily starc+ band was tested on Monday.
- The more important 61.8% resistance is at $143.02 with chart resistance at $143.72, which was the November 2 high.
- There is initial support now at $139.50 with the flat 200 day MA at $138.52. There is more important support now at $136.60.
- The NYSE A/D line has tested its downtrend, line b, as it has moved well above its flat WMA.
- The A/D turned down Tuesday and could pull back towards its recent lows. It has long-term support at line c, which corresponds to the July highs.
- The McClellan oscillator has rallied above its downtrend (line d) as it has risen from an oversold reading of -279 to Monday’s high of +153.
- The break of the downtrend in the McClellan oscillator is consistent with the bottoming process.
The December E-Mini S&P 500 futures has turned lower from the 50% Fibonacci retracement resistance at 1404.50 and the downtrend, line e, as the high Tuesday was 1407.75.
- The 61.8% retracement level is at 1419.50 with key chart resistance at 1431.75.
- There is initial support at 1385-1387, which if broken will confirm that the short term sellers are back in charge.
- There is further support at 1373 to 1366 and then the November 15 closing low of 1351.50.
- The daily on-balance volume (OBV) was able to move above its WMA on the recent rally, but is still below its downtrend, line f.
- The weekly OBV (not shown) did confirm the September highs, but is now below its WMA.
NEXT PAGE: What to Do?
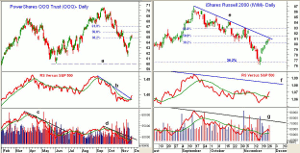
|pagebreak|The PowerShares QQQ Trust (QQQ) has rallied over 5% from the month’s low at $61.50. In June the low was $60.39, line a.
- The 38.2% resistance level at $64.83 has been exceeded with the 50% Fibonacci retracement resistance at $65.93.
- The daily relative performance or RS analysis has broken its short-term downtrend, line b, and moved back above its WMA.
- It will take another week or so before a new uptrend in the RS line can be confirmed.
- Volume has dropped off over the past few days, but still the OBV is back above its WMA but below the downtrend, line d.
- Last June the break of the downtrend in the OBV, line c, signaled that QQQ was bottoming.
- There is initial support for QQQ at the gap in the $63.60 to $64.25 area with additional at $62.50-$63.
The iShares Russell 2000 (IWM) rallied nicely from the long term 38.2% retracement resistance that goes back to the 2011 lows.
- IWM was able to overcome the 38.2% retracement resistance as the daily downtrend, line e, has been reached.
- The 50% resistance level now stands at $81.53.
- The relative performance has moved back above its WMA and a move above the resistance from October would be a positive sign.
- The long-term downtrend, line e, is still much higher.
- The OBV is above its WMA but below the long-term resistance at line f.
- There is initial support for IWM at $79.35-$79.90 and then $78.50-$78.80.
What it Means: For investors, the question is whether they should stick with their positions and with stops in place ride out the correction or whether it is better to reduce their equity exposure?
I would not be surprised to see some fairly heavy selling if the major averages break their initial support levels. Though I do not expect the November lows to be tested or broken, it cannot totally be ruled out.
If the lows were broken, many of the key technical indicators are likely to form positive divergences consistent with the formation of a bottom. A more likely scenario, in my opinion, will be a sharp but short drop that will hold well above the recent lows.
For the investor, now is an important time to have your plan in place including hard stops on all your positions. I would not expect the stronger stocks to violate their mid-November lows and they could be used as guidance in stop placement.
NEXT PAGE: How to Profit and Portfolio Update
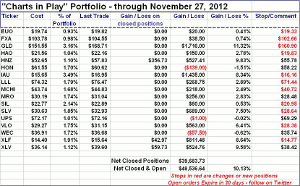
|pagebreak|For those who are more than 65% invested in stocks and nervous about their equity exposure, buying an inverse ETF, like the ProShares Short S&P 500 (SH), is a prudent choice. Even though the Charts In Play portfolio is not that fully invested, it will be included for those more nimble or short-term investors.
How to Profit: I would go 50% long the ProShares Short S&P 500 (SH) at $34.93 and 50% long at $34.74 with a stop at $34.08 (risk of approx. 2.1%) Cancel if $35.20 is hit first. On a move above $35.55, raise the stop to $34.58. Follow me on Twitter for updates on this and other positions.


