
The USD Index measures the performance of the US Dollar against a basket of currencies such as the EUR, JPY, GBP, CAD, CHF, and SEK. Greg Harmon of Dragonfly Capital offers a long-term technical view of this important index.
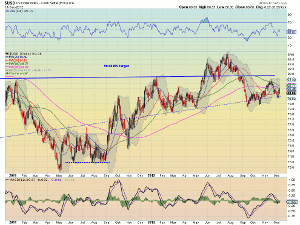
Currencies have played a major role in the economies and markets this past year. The euro weakening and the Swiss franc strengthening. But throughout the perception of the US dollar has been mixed. Up one week, down the next. Very tough to pin down whether it will strengthen due to concerns abroad or weaken due to our own fiscal issues. So what do the charts say? Starting with the daily picture, the Index has been finding support at the extension of the long-term rising support trend line and tangled in the Simple Moving Averages (SMA). Most recently it is making a series of higher lows and higher highs suggesting an uptrend continuing.
Click
to Enlarge
The improving Moving Average Convergence Divergence indicator (MACD) agrees with this. Despite being negative, it is improving. But the Relative Strength Index (RSI) suggests that the next move will be lower with a bearish reading and pointing lower. It should be noted that the inverse head and shoulders that triggered in May 2012 is still valid, with a target of 90.60, until any move below the right shoulder at 78.10. But there is also a head and shoulders top that triggers below 78.60 with a price objective of at least 73.20. If you had to sum up the daily chart with one word, it would be confusion. Moving out the weekly view provides a lot more clarity.
Click
to Enlarge
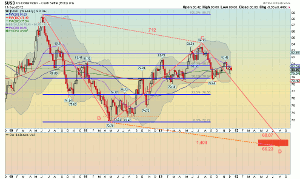
The chart below shows it carving out a AB=CD pattern with a potential reversal zone between 68.07 and 66.23 sometime around August 2013. Undoubtedly down. Measurements are very close to the square root of 0.5 and the square root of 2 on the legs. A move below the 78.84 Fibonacci, 100-week SMA at 78.49 and previous lows at 78.60 and 78.10, free it for a move lower.
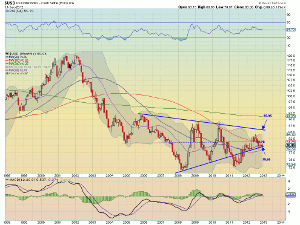
Finally moving out to the broad monthly picture there is a prominent seven-year long symmetrical triangle after a long move lower off of the double top at 120. The last three months have been testing the bottom rail with a series of doji prints.
Click
to Enlarge
A move under that rail triggers a target from the pattern to 58.65. It also continues the downward move with what seems like a silly target of 42.40. Silly or not, there is nothing in the weekly or monthly charts that shows strength. Recapping, look for 73.20 as the first support below the current range at 78.60, followed by the range 66.23 to 68.07, culminating at 58.65 or 42.40.
By Greg Harmon of Dragonfly Capital


