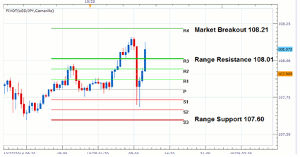
Walker England of DailyFX.com charts how this currency pair failed to breakout to higher highs as many other yen pairs did on Tuesday morning and what this means for currency traders depending on either the next upwards or downwards breakout scenario.
USD/JPY 30Minute Chart

(Created using FXCM's Marketscope 2.0 charts)
Click to
Enlarge
The USD/JPY has failed to breakout to higher highs, as many other yen pairs have done Tuesday morning. The USD/JPY can be considered range bound as long as price remains under the R4 pivot at 108.21. In the event price moves back below Range Resistance at 108.01, traders can again begin looking for reversals towards support. Price support currently sits at the S3 pivot at a price of 107.60, which completes Tuesday's 41 pip trading range.
In the event that the R4 pivot does break, traders can begin looking for continued bullish momentum on the USD/JPY back in the direction of last week's trend. Conversely, a move through support and below the S4 pivot at 107.39 would signal a larger price reversal on the creation of a new lower low. In either breakout scenario, the range would be considered concluded, at which point reversal traders can consider new orders in the direction of the breakout.

(Created using FXCM's Marketscope 2.0 charts)
Click to
Enlarge
By Walker England, Trading Instructor, DailyFX.com


