Forex trader and blogger Graham Blackmore, of TheForexGuy.com, highlights the two critical steps to using support and resistance levels that every forex trader must fully comprehend even before implementing them as trading tools.
Understanding levels of support and resistance may be the single most important aspect of your technical analysis as a forex trader and should always be factored in before making any trading decision. There are two different steps to using support and resistance levels (aka, S/R levels) that you must understand before you can successfully use them as a tool. The first step is to identify where to place these demarcating lines and the second step is to foresee how these levels may affect your trades and to take that analysis into consideration before placing a trade. In this article, I will be discussing the first step: reading a chart and deciding where to place your S/R levels.
So, what are levels of support/resistance? Simply put, a level of resistance is where price resists moving higher due to the selling activity of other traders and a level of support is where price resists moving lower due to buying activity of other traders. Identifying levels of S/R is not an exact science, but it is fairly simple and, for most people, it only takes a little time to start to feel comfortable with deciding where to place these lines on their charts. Here are some guidelines to follow:
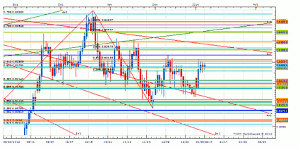
Levels of support/resistance can be identified on any time frame; however, the most significant (i.e., strongest) are found on the higher time frames such as daily, weekly, and monthly. Personally, I prefer using the weekly chart to identify the relevant levels. Don’t become obsessed in support and resistance levels, you only need to mark the important ones. If you dive down into the 5-min time frame and plot every single possible support and resistance level, you’re going to create a very confusing and ineffective trading environment.
Don’t do what this trader has done and over complicate the process.
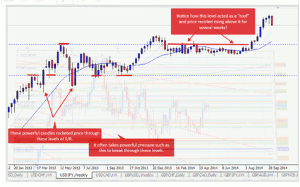
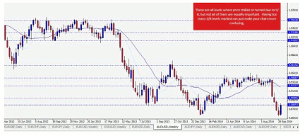
In the USD/JPY weekly chart below, we have a bullish trend occurring, and I have chosen two S/R levels (where I placed the dotted blue lines). You can see how price “respects these levels” by touching or piercing the level (but rarely closing on the other side of it).
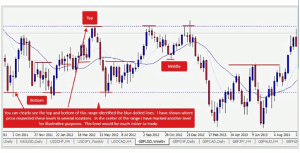
During ranging markets, focus on the range top and bottom (these are the main turning points), don’t let yourself get caught up within the noise in the center of the range. For example, in the chart below GBP/USD price was in a range from about September 2010 to around October 2012. If you were to look at the lower time frames within this period, you could identify other levels of S/R but the weekly chart gives us a clear picture of the top and bottom of the range. The levels within the range are less of a certainty and if you decided to trade based on them, it would be considered a higher risk trade.
NEXT PAGE: Don’t Overdo It
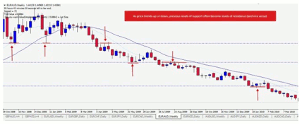
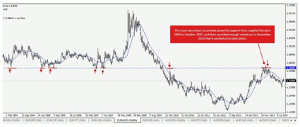
|pagebreak|In a trending market, you won’t see that many common points of support or resistance, because price is climbing or falling in a steady pattern. So instead, you should focus on potential swing levels (old resistance acting as new support or vice versa) and major weekly levels which could potentially terminate trend movement. This is illustrated in the EUR/AUD weekly chart below:
Don’t overdo it. You shouldn’t have twenty levels of support/resistance identified on every chart. We are looking for two or three areas where price respected the level or required a very strong push (think long candles) to break through it repeatedly. What you want to identify are those levels that show several incidences of price stalling and/or reversing.
If you overdo it with your S/R lines, the noise will make the important levels invisible to the eye, this is no way to learn forex trading. You’re just going to confuse and frustrate yourself in this scenario, and you may miss signals or fail to foresee the really big moves that are likely to occur, see this chart below:
The most important S/R levels are the most recent levels, however, you may discover that price continually reacts at the same level year after year. Pay attention because these can be very important.
Even though you will be marking your chart with a line, keep in mind that an S/R level is really a small range so price may not react exactly on that line, but should respond in that general area.
If price is continually zig-zagging its way through a previous S/R level that you have marked on your chart, do not attempt to trade there at this time. Sometimes a level becomes irrelevant, because traders no longer regard that price level as a great buy/sell point. Just remember that what is happening in the most recent past is most important.
Many successful trading systems use support and resistance paired with other price action signals to build confirmation as to the probability of a trade’s success. Next to price itself, support and resistance is the granddaddy of all technical indicators and should be the backbone of any successful trading system.
By Graham Blackmore, Forex Trader and Blogger, TheForexGuy.com

