
Volatility and divergence are increasing, as stocks add poor economic data to the cart they're dragging. A short-term top is likely close, and MoneyShow's Tom Aspray explains the telltale signs investors should watch for.
Stocks closed lower Friday, breaking a four-day winning streak, although the Dow almost made it back to positive territory after falling quite a bit in early trading. Though the widely anticipated earnings from JPMorgan Chase (JPM) and Wells Fargo (WFC) were better than expected, both stocks fell.
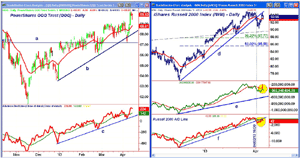
Last week's surge to new all-time highs in the S&P 500 caught many of even the most bullish analysts by surprise, as it came very close to the next magic target at 1,600. Still, not all market averages are in sync; the Dow Transports and Russell 2000 have been diverging since early April.
The selling early Friday was due in part to the much weaker retail sales report, which was the lowest in nine months. That was followed by the preliminary University of Michigan consumer sentiment survey, which was also much lower than March's final reading of 78.6.
Longtime readers are likely surprised that I would suggest stock prices now might be projecting a too-positive short-term economic outlook. Many times over the past two years (such as Armageddon Fears Are Overblown on June 1, 2012 and Can Doom and Gloom Save the Market? on September 16, 2011), I have made the case that the internal strength of the stock market was signaling that the economy was actually stronger than most thought.
The technical picture for the stock market is still positive, as is my view for the economy. That said, I currently think prices may not be supported by the economic data in the next few weeks.
If the stock market completes a short-term top in the coming weeks, as it has in the past three years, it would allow for stock prices to get back in line with the economy.
Click to Enlarge
The market still needs a stronger technology sector to help push it to much higher levels, and this is a strong seasonal period for many of the technology industry groups.
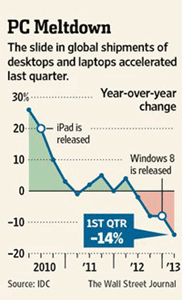
However, this chart of PC shipments from The Wall Street Journal confirms that tablets and phones are the future as PC sales slump. While tech giants like Intel (INTC) and Microsoft (MSFT) are trying to adapt to this trend, they have some catching up to do.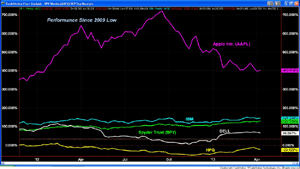
Click to Enlarge
This comparison chart of the PC makers since the start of the bull market shows that despite its decline from the 2012 highs, Apple (AAPL) is still leading—up 403%, which is almost three times better than IBM's 145% gain.
The Spyder Trust (SPY) is not far behind IBM, while Dell (DELL) is up just 67% and Hewlett-Packard (HPQ) is down almost 23%. Of course, this is just one part of the technology sector, but it does suggest we should look out for new bellwether tech stocks.
NEXT: What to Watch
|pagebreak|In Asia, the main focus has been on Japan's aggressive monetary easing, which pushed the yen-dollar close to the 100 level last week.
Having written and analyzed the Japanese market since the Nikkei peaked in 1989, I think this is just the start of what may be a long-term trend. Therefore, I will be looking for a pullback to buy.
Of course, the state of the Chinese economy is also getting quite a bit of attention. The sharp drop in their inflation rate last week was taken as a sign that the country's economy is recovering at a reasonable rate. Many of the China-focused ETFs may be close to bottoming, and I would expect them to be higher by the end of the year.
The Eurozone has again moved to the back burner, but I do not expect that to last too long. In fact, if we get a bad economic number with the market already rattled by a new Euro crisis, we could see a wave of heavier selling.
This week, it will be important to keep an eye on rates, as it appears that the rally from last summer's low yields has run out of steam. Later, I will give you some key levels in the ten-year T-Note yield to watch.
We start off our economic reports this week with the Empire State Manufacturing Survey on Monday, along with the Housing Market Index, which reflects the outlook of the homebuilders. The Consumer Price Index is out on Tuesday, along with housing starts and industrial production.
On Thursday, in addition to jobless claims—which have been edging higher recently—we get the Philadelphia Fed Survey and the Leading Indicators.
What to Watch
Since the last column, the Spyder Trust (SPY) dropped back to stronger support, generating what I call a yellow flag or cautionary signal. This was followed last week by new highs in the Dow Industrials, and more importantly new all-time highs in the S&P 500.
These new highs have not been confirmed by some of the other market averages, notably the Dow Transports and Russell 2000. A further decline in these two indices early this week could generate stronger sell signals, as discussed below.
The bearish commentary in the financial media seems to have died down. Those who have been calling for a top since early February appear to have thrown in the towel. Clearly, the powerful rally last Wednesday that accompanied the early release of the FOMC minutes squeezed some of those on the short side.
As most profitable short sellers know, it is mandatory to have a clear exit level on short positions, which is normally based on former highs. But with the S&P at new highs, this is not possible. I felt the new highs had many asking what to do now. So I tried to address this in last Thursday's column, Buy, Sell or Hold?.
I also reported the dramatic 16.2% plunge in bullish sentiment for the AAII. It was reported at its lowest level since March 5, 2009. Subsequently, it was revealed that this week's sample size was about 50% of normal, so I am skeptical that it is really an accurate reading.
As I have said for a few weeks, it is a tough market to buy. One of last week's few recommendations was a chemical company with a 3.3% yield that had dropped back to test the lows from early in the year.
Click to Enlarge
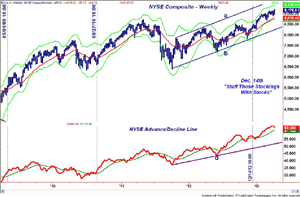
The weekly chart of the NYSE Composite shows a higher weekly close. The Starc+ band now stands at 9,434, which is about 2.8% above Friday's close. The quarterly R1 resistance is at 9,300. The upper boundary of the trading channel is at 9,650, and NYA is still well below its all-time high of 10,413.
The weekly NYSE Advance/Decline line looks ready to turn lower this week, but is still well above its rising WMA. There is good support at the late 2012 lows.
The first support is at 9,120, with the quarterly pivot at 8,938. The rising 20-week EMA is at 8,818, which is 3.8% below Friday's close.
The number of stocks making new highs on the NYSE hit 377 last week, which was still below the 2013 highs of 430 to 440. The H-L indicator I discussed in Tracking the Market's Trend is now back above its SMA, but still below its previous peaks.
NEXT: Stocks
|pagebreak|S&P 500
The Spyder Trust (SPY) hit a new rally high last week of $159.71, which was just below the quarterly R1 at $160.31, and came very close to the daily Starc+ band. The weekly Starc+ is at $162.35 for this coming week.
There is first support now at $157.20, with the rising 20 day EMA at $156.32. The short-term uptrend line sits at $154.61.
The daily on-balance volume (OBV) moved back above its WMA last week, but did not make new highs (line b). It would take a drop below the recent lows to confirm the divergence.
The S&P 500 A/D line did confirm the recent highs, but it also turned lower Friday. It is still above its rising WMA and the uptrend (line d).
Click to Enlarge
Dow Industrials
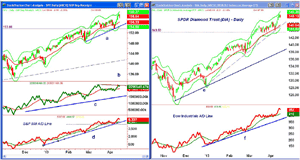
The SPDR Diamond Trust (DIA) made much higher highs at $148.66 last Thursday, reaching its Starc+ band in the process. The quarterly R1 resistance is at $149.81, and the weekly Starc+ band follows at $150.55.
The daily Dow Industrials A/D line was able to move well above its previous highs, confirming the price action and suggesting that is becoming one of the stronger market areas. Initial A/D support is at its WMA, and it is well above its uptrend (line f).
The first support is at $146.47, which was the previous high, and then at $145.64 and the rising 20-day EMA. The more important support from March's trading sits at $143.53.
Click to Enlarge
Nasdaq-100
The PowerShares QQQ Trust (QQQ) had a sharp drop a week ago to reach $67.19 and break its daily uptrend (line b). The reversal was equally dramatic, as three days later it accelerated to make new highs for the year at $70.17. This was just below the September 2012 high of $70.58.
The Nasdaq-100 A/D line held its uptrend (line c) on the drop, and made new rally highs last week. The ley level of support is now the uptrend and the April 5 low. The A/D line is still well below the highs it made in April 2012.
QQQ has first support at $69.27, with its rising 20-day EMA at $68.80.
Russell 2000
The iShares Russell 2000 Index (IWM) rebounded nicely last week, gaining 1.8%, as it tested its former downtrend before turning lower on Friday. More troublesome is that the daily technical studies are acting weaker than prices.
The weekly OBV is just testing its WMA, but the daily OBV shows a pattern of lower highs, as it tested its declining WMA last week. A drop in the OBV below the prior lows would signal a further decline.
The Russell 2000 shows a similar pattern, as it just rebounded back to its former uptrend (line f) before turning lower and dropping back below its WMA (see circle).
On a drop below $92, the quarterly pivot is at $91.81. The 38.2% Fibonacci retracement support from the high at $94.96 is now at $87.77.
NEXT: Sector Focus, Commodities, and Tom's Outlook
|pagebreak|Sector Focus
The iShares Dow Jones Transportation (IYT) also had a good week, up around 1.6%, but like IWM the rally stalled at key resistance.
Therefore, the quarterly pivot support at $105.99—which was broken on the recent correction—now becomes more important. The IYT really needs to move back above the $111.62 level to reassert the uptrend.
The table below was repeated from last Friday's column, because I thought it was important for everyone to note the disparity in the performance of the different sectors so far in 2013. On the one hand you have the Select Sector SPDR Health Care (XLV) up 20%, while the Select Sector SPDR Materials (XLB) is up less than 5%.

Click to Enlarge
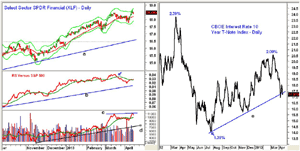
In the article, I focused on the top four performers, but one I did not feature (but am watching closely) is the Select Sector SPDR Financials (XLF), which tested its daily Starc+ band on Thursday before declining Friday.
On April 5, XLF bounced to new highs after testing the quarterly pivot at $17.79. This now becomes an important level of support. One of my concerns is that the daily relative performance may have topped out, as it has dropped below its WMA and broken below the late February lows.
Click to Enlarge
The daily OBV did make slightly higher highs (line c), but also turned lower on Friday. There is now important OBV support at line d.
Interest Rates
The yield on the ten-year T-Note dropped to a low of 1.75% on April 5 before rebounding back above the 1.8% level in the middle of last week. The decline did break the uptrend (line e) that goes back to last summer's lows, and a drop back below 1.75% will indicate the rally in yields is over.
Crude Oil
June crude oil was hit hard last Friday, losing over $2.40 per barrel and closing just above the early March low of $90.23. A drop below this level will signal a decline to the $88 area. Remember that the action in crude oil often leads the stock market by a few days.
Click to Enlarge
Precious Metals
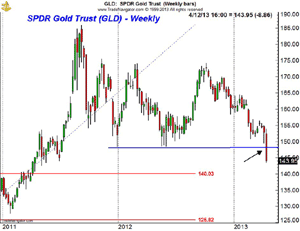
The carnage in the gold market was even more dramatic than crude oil, as the June Comex gold contract lost over $80 per ounce. The chart of the SPDR Gold Trust (GLD) shows that the lows at $148 going back to late 2011 were broken, as it closed in the $145 area.
The major 38.2% Fibonacci support that goes back to the 2008 low is at $140, which is the next likely downside target. The 50% support is at $125.82.
Traditionally, April has been a good month for gold, even though the main seasonal low occurs in July. Aggressive investors who went long at $154.50 were stopped out at $149.65 for a 3.1% loss.
The Week Ahead
I hope some of you concentrated on managing your existing positions, as I recommended two weeks ago, because the next few weeks are likely to be difficult.
The way stocks came back from the early lows on Friday allows for another move to new highs in the S&P 500 and the Dow Industrials, depending on the earnings data.
I am finding little I want to buy at current levels, but as I noted earlier, some of the overseas markets are getting back to more important support. I have continued to suggest taking profits even on strong stocks, and have been trying to weed out those stocks that are not keeping pace with the market.
For those that started a dollar-cost averaging program at the end of 2012, I still think this is a good long-term play, but I might scale back my contributions until the risk falls somewhat. I will be updating the Charts in Play portfolio early this week.
- Don't forget to read Tom's latest Trading Lesson, Tracking the Market's Trend.


