Back-to-back weak economic data reports arrested the market's erstwhile relentless uptrend, and MoneyShow's Tom Aspray takes a technical look to determine whether this is just a hiccup or an early warning of a deeper correction yet to come.
Despite the early positive action in the stock market Wednesday, it did not last long as the ADP Employment Data turned the focus on the downside. The ISM report was also weaker than expected and the afternoon saber rattling by North Korea did not help.
Stocks did rebound in the last hour and the futures were flat in early trading Thursday. Of course, we get the jobless claims today before the opening, with the monthly jobs report on Friday. As I noted yesterday, it has become a split market with the small-cap Russell 2000 the weakest, dropping 1.7% Wednesday, and the iShares Dow Jones Transportation ETF (IYT) was also down 1.4%.
The iShares Russell 2000 Index (IWM) is the only one of the key ETFs that is currently trading below its quarterly pivot support levels that were discussed in yesterday's column. A weekly close below its pivot would clearly weaken the outlook for the small caps.
So how significant was Wednesday's drop? Was it just a normal pullback in a strong uptrend and is there still a green light for stocks? Or is the market sending a more important message to investors? Could this be the start of a spring selloff like those we have seen over the past three years? Let's take a look.
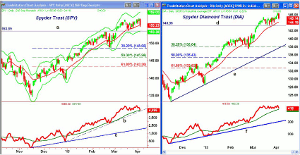
Chart Analysis: The daily chart of the Spyder Trust (SPY) shows the sharply lower close on Wednesday. The SPY made a new high this week at $157.21.
- The low last week was at $154.35 with more important support, line a, at $153.59.
- A weekly close below this level would be the first clear sign that the SPY had completed a short-term top.
- Using this week's high, the 38.2% Fibonacci support is at $148.66, which is very close to the February lows.
- The S&P 500 Advance/Decline is holding up quite well as it did confirm the recent highs and is now testing its rising WMA.
- The A/D line is still above its short-term uptrend, line b, and is well above long-term support (line c).
- There is initial resistance now at $155.67 and $156.37.
The SPDR Diamond Trust (DIA) is acting the best of the four ETFs suggesting that investors are favoring the higher-yielding large-cap stocks.
- DIA made a high of $146.50 Tuesday, and despite the sharp decline, the chart still looks positive.
- The 20-day EMA is at $144.19 with more important support now at $143.46, line d.
- Though it is possible that DIA will make further new highs, the 38.2% support from Tuesday's high is at $138.04 with the uptrend, line e, a bit higher.
- The Dow Industrials A/D line is still well above its WMA and made marginal new highs this week.
- There is major support for the A/D line at the uptrend, line f.
- There is initial resistance at $145.78 to $146.24.
NEXT PAGE: 2 Sectors Set to Go Lower
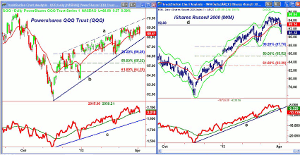
|pagebreak|The Powershares QQQ Trust (QQQ) has been lagging all year as it has failed to even reach much last September's highs.
- The QQQ closed on its 20-day EMA with the quarterly pivot just slightly lower at $68.
- There is further support at $67.62-$67.77 and the uptrend, line d.
- The 38.2% retracement support from this week's high is at $66.26.
- The daily chart shows a potentially bearish rising wedge formation, lines a and b.
- The Nasdaq 100 A/D line has dropped below its WMA with more important support at the uptrend, line c, and the February lows.
- There is first resistance at $69-$69.27.
As I noted yesterday, the iShares Russell 2000 (IWM) has been diverging from the SPY as it broke its uptrend on Tuesday.
- IWM closed at the daily starc- band and below the quarterly pivot at $91.50/$91.81.
- The 38.2% Fibonacci support is at $87.75 with the S1 quarterly support at $88.03.
- The 50% retracement support is at $86.52 with the 61.8% support at $83.29.
- The Russell 2000 A/D line has dropped well below its WMA and its uptrend, line c.
- There is initial resistance now in the $92 area with the 20-day EMA at $93.14.
- A rally or some stabilization is likely in the next few days
What it Means: In Nascar terms, the yellow flag is basically a sign of caution, and I think the drop Wednesday was an early warning sign. Typically, a significant top will normally take at least several weeks to develop.
Therefore, I would not be surprised to see the Spyder Trust (SPY) and SPDR Diamond Trust (DIA) to make further new highs before a top is completed. This is less likely for the Powershares QQQ Trust (QQQ), and I think the highs are in place for the iShares Russell 2000 (IWM).
How to Profit: Once the current correction is over, the strength of any following rally will be important, and it should tell me more. Be sure to have your stops in place on any long positions.
Portfolio Update: The remaining long position in the iShares Russell 2000 (IWM) from $82.55 was sold Wednesday at $92.94 as the high was $92.98.


